
Fleet Vehicle Health Twins
A digital twin in logistics compares live engine readings with a physics baseline for each truck. It flags developing faults weeks before a roadside breakdown and shows the evidence.
See: Vehicular Health Monitoring →Digital Twin for Transportation & Logistics
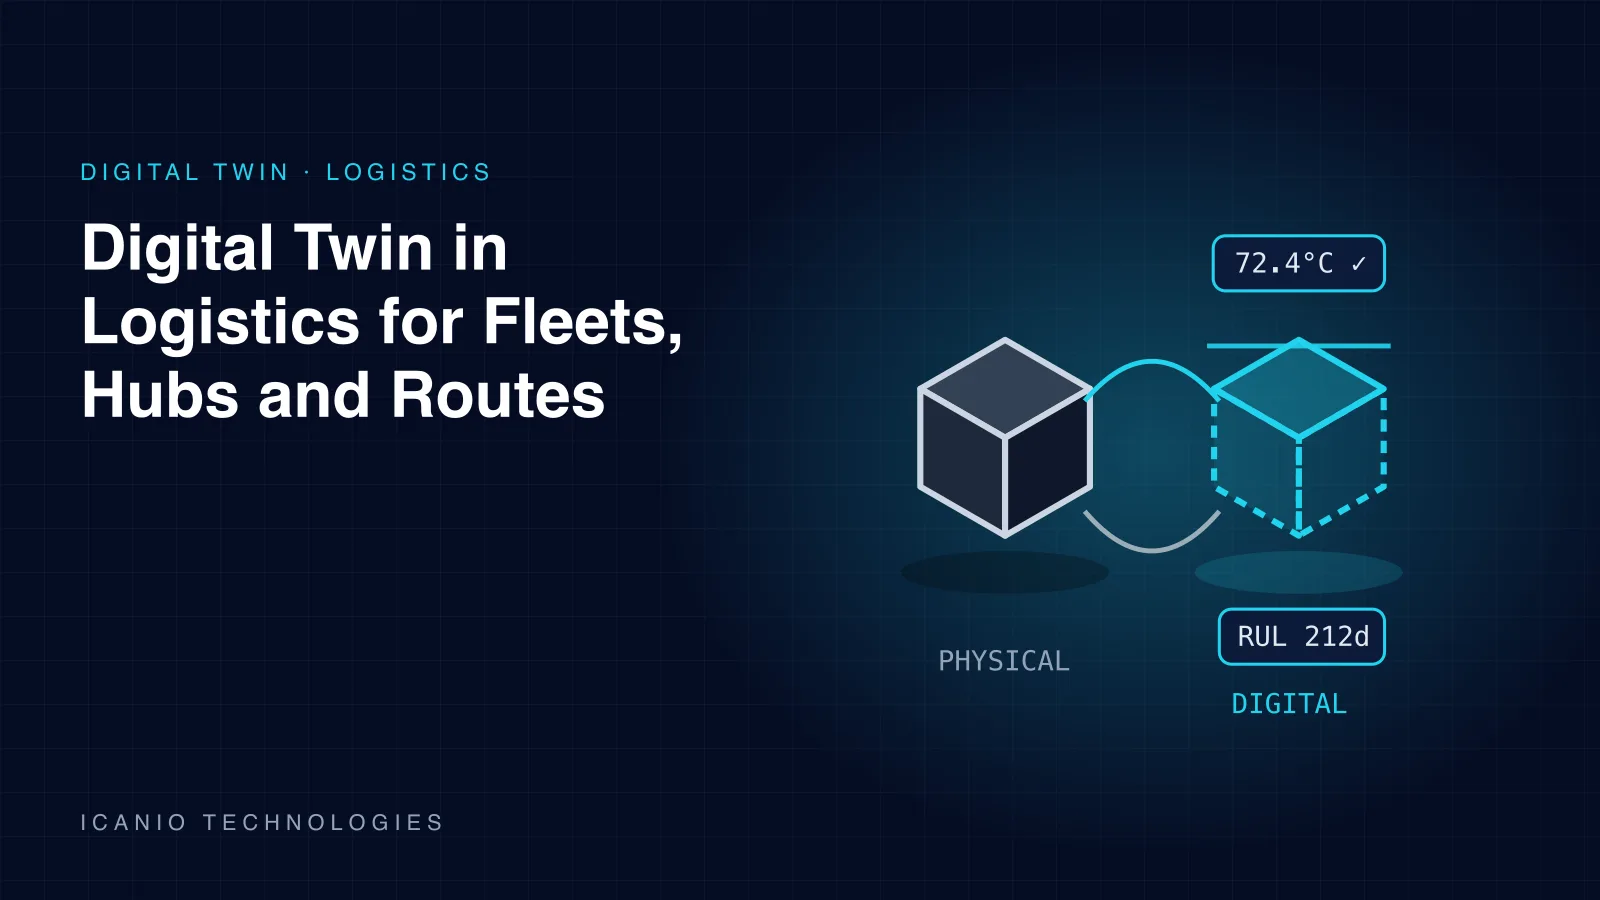
We build a digital twin in logistics that mirrors your vehicles, warehouses and delivery network live. It reads telematics, WMS and TMS data, flags faults early and tests network changes safely.
Delivery Truck TR-21
Route N4 · 7.5t rigid
Remaining life
212 days
Coolant
90.3°C
Oil pressure
3.89bar
Fuel use
19.4L/100km
✓ All signals within physics baseline
A digital twin in logistics is a live model of the assets that move your freight: trucks, trailers, sorters, docks and the network that links them. It updates from telematics and warehouse data as things happen, not at the end of the day.
Logistics operators already have plenty of data. Telematics sits in one portal, the WMS in another and the TMS in a third. When a truck breaks down or a sorter jams, each team sees only its own slice of the problem.
Our team joins those feeds into one digital twin in logistics, then adds physics models and predictive AI. The twin warns of vehicle faults before the dashboard light, shows how delays ripple through a hub and lets planners test route or shift changes first.
A digital twin in logistics is a virtual replica of a vehicle, facility or network that stays synchronised with the real thing. GPS, engine data, scan events and dock status stream in continuously. The model reflects the current state of your operation minute by minute.
It works at three levels. A vehicle twin watches engine and component health. A facility twin models a warehouse or cross-dock, with its sorters, doors and labour. A network twin links lanes, hubs and carriers so planners can see how one disruption spreads.
The live link is what matters. A route optimiser plans the ideal day. A digital twin in logistics compares that plan with what trucks and sorters are actually doing, then flags where reality is drifting.
Operations definition
“A logistics digital twin is a continuously updated virtual model of fleets, facilities and freight flows. It fuses telematics, WMS and TMS data with physics and machine learning to predict problems and guide dispatch decisions.”
Foundations
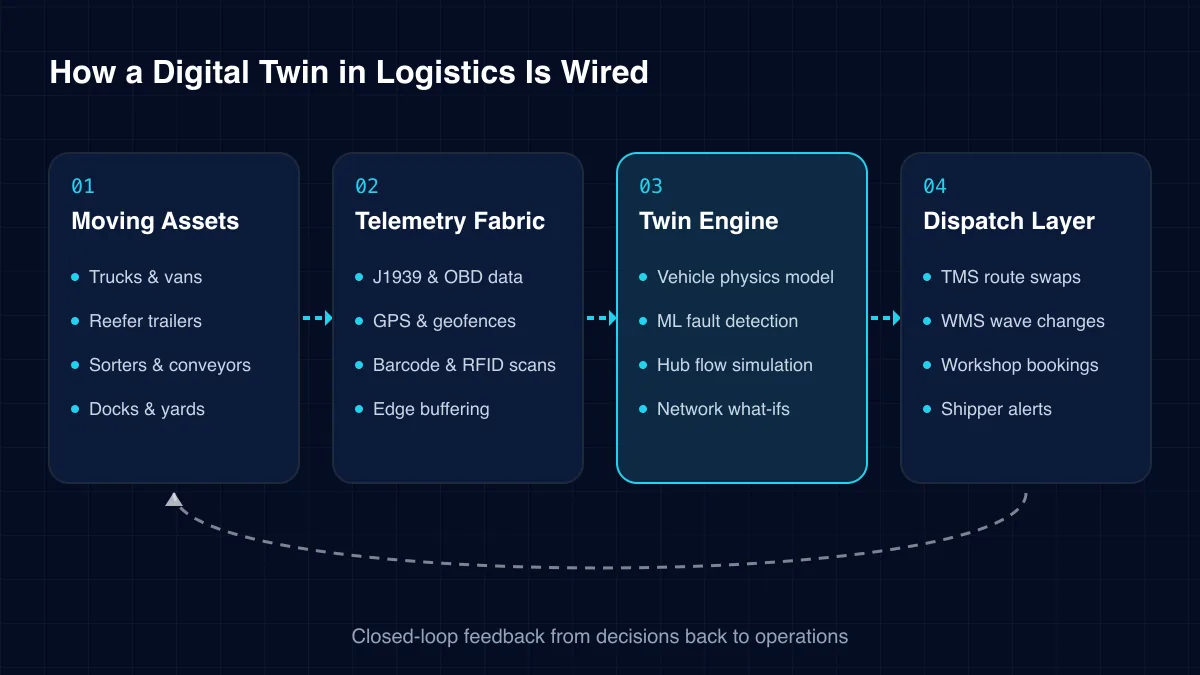
Engine data over SAE J1939 or OBD, GPS pings, reefer temperatures and barcode or RFID scans form the live feed. We ingest them without changing the devices already fitted.
Engine and thermal models describe how a healthy vehicle should behave on today's route and load. That lets the AI tell a failing part from a steep hill.
Discrete-event models of hubs, docks and lanes show how parcels, pallets and trucks queue. They turn a delay in one place into a forecast for the rest of the network.
Alerts become workshop bookings, route swaps or wave changes in the TMS and WMS. Dispatchers approve the move, so humans stay in charge of service promises.
Core capabilities
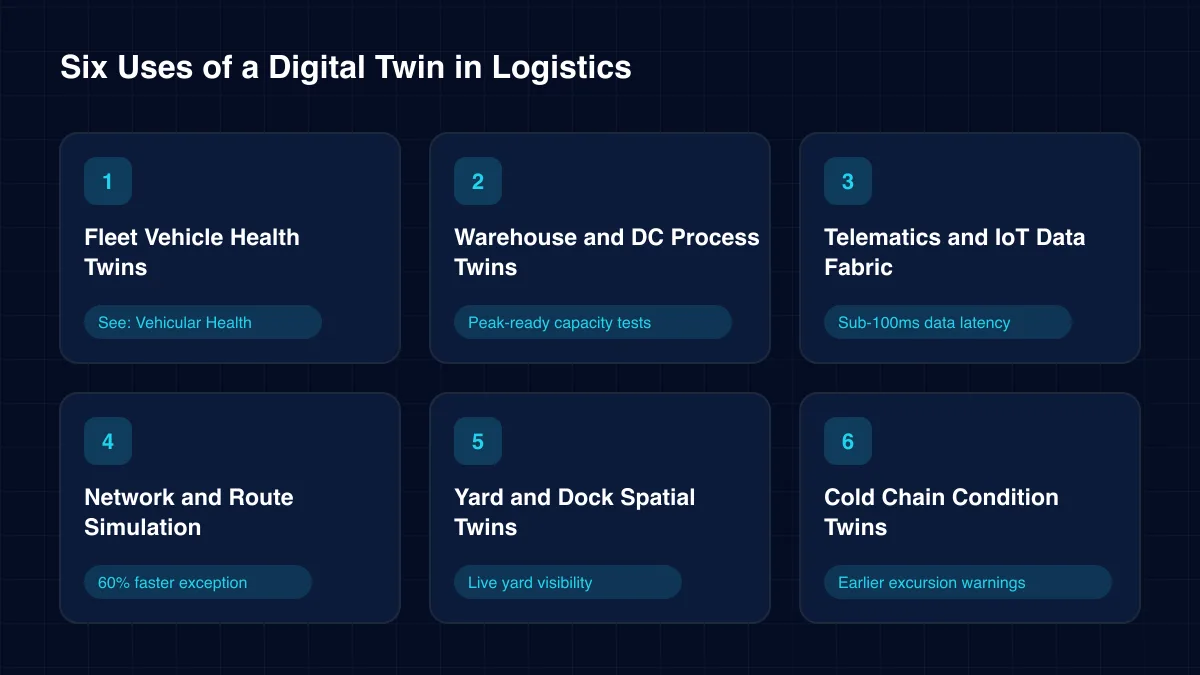
These are the places where a digital twin in logistics pays back fastest. Most operators start with vehicle health or one hub, then widen the model.
A digital twin in logistics compares live engine readings with a physics baseline for each truck. It flags developing faults weeks before a roadside breakdown and shows the evidence.
See: Vehicular Health Monitoring →Model sorters, conveyors, pick zones and labour in one view. Test a new slotting plan or wave schedule on the twin before peak season.
Peak-ready capacity tests
Unify feeds from mixed telematics vendors, reefer units and handheld scanners into one real-time stream. Edge buffering covers dead zones on rural routes.
Sub-100ms data latency
Mirror lanes, hubs and carrier capacity end to end. See how a closed road or a late linehaul affects every downstream delivery window.
60% faster exception resolution
A 3D model of the yard shows trailer positions, door status and dwell time. Yard teams stop hunting for trailers and doors turn faster.
Live yard visibility
Track box temperature, compressor duty and door openings for every reefer. The twin spots a failing unit before the load goes out of range.
Earlier excursion warnings →Architecture
Each digital twin in logistics we build follows four layers. Movement data rises from vehicles and hubs into the model, and dispatch decisions flow back out.
01
02
03
04
Challenges we solve
These are the problems we hear most from fleet and warehouse leaders. Each one comes from data that exists in separate systems but is never joined.
A truck that fails mid-route strands freight, a driver and a customer promise. Mileage-based servicing misses faults that build between visits.
By the time the dashboard light appears, damage is often done. Operators have no view of developing engine problems before that point.
Sorters and docks that cope in March jam in November. Planners discover the limit only when parcels start missing their trunk.
Each system tells part of the story. Teams spend the morning stitching exports together instead of fixing the exception.
A reefer that slowly loses capacity may still hold temperature on a cool day. On a hot day the load fails and the claim follows.
Opening a new hub or changing a linehaul schedule is usually trialled on real freight. Mistakes show up as late deliveries.
Scope grows in stages. We usually start with one asset class and widen once the first model earns trust.
Operators often ask why they need a digital twin in logistics when they already have telematics and route planning tools. The table shows the difference.
| Capability | Telematics portal | Route optimiser | Logistics digital twin |
|---|---|---|---|
| Live vehicle data | ✓ Yes | Partial | ✓ Yes |
| Predicts component faults | No | No | ✓ Yes |
| Simulates hub and network flow | No | Partial | ✓ Yes |
| Joins WMS, TMS and telematics | No | No | ✓ Yes |
| Explains why an alert fired | No | No | ✓ Yes |
The value of a digital twin in logistics compounds as more vehicles, hubs and lanes join the model.
Delivery
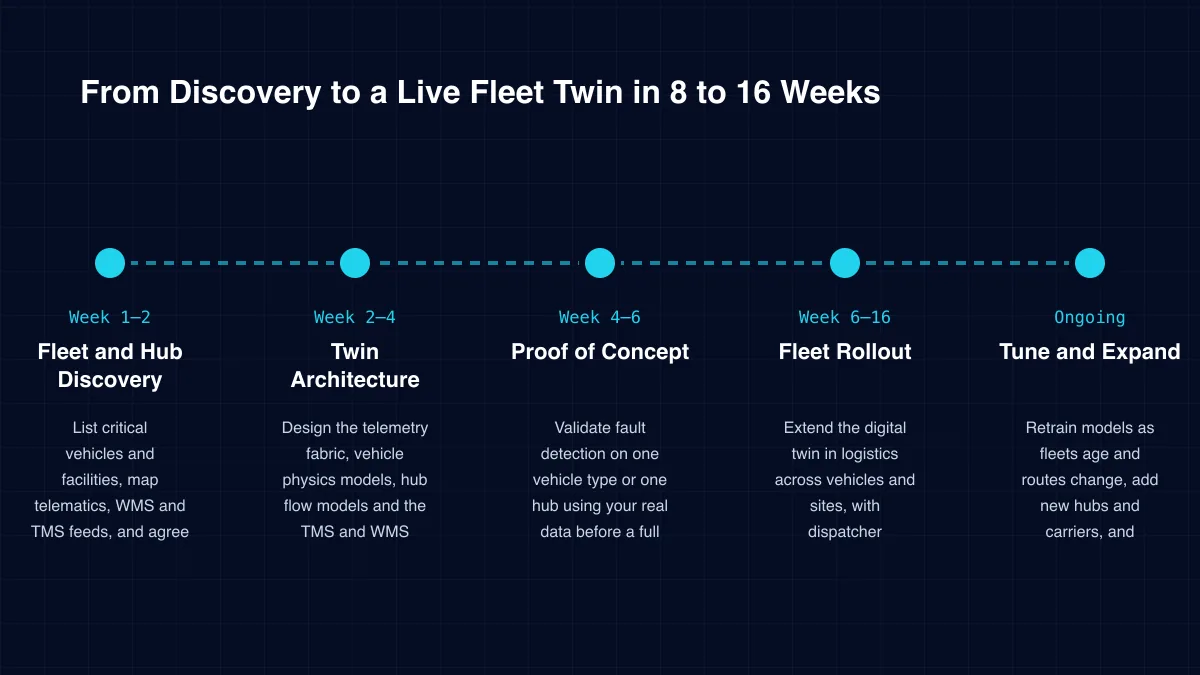
Week 1–2
List critical vehicles and facilities, map telematics, WMS and TMS feeds, and agree the downtime and delay baseline.
Week 2–4
Design the telemetry fabric, vehicle physics models, hub flow models and the TMS and WMS integration points.
Week 4–6
Validate fault detection on one vehicle type or one hub using your real data before a full build commitment.
Week 6–16
Extend the digital twin in logistics across vehicles and sites, with dispatcher dashboards and write-back to operations.
Ongoing
Retrain models as fleets age and routes change, add new hubs and carriers, and support teams under an SLA.
Case study
A fleet management technology partner needed to see engine faults before breakdowns, not after the warning light. Our team built a live, physics-based mirror of a vehicle engine. The proof of concept validated the full pipeline end to end on a simulated mid-size petrol sedan and detected two distinct real-world engine faults.
“The goal was never just an alert. It was an alert an operator could actually trust and act on.”Read the full case study →
CARLA · OpenModelica FMU
Models how a healthy engine should behave under current driving conditions.
XGBoost · Rule engine
Compares live readings with the healthy baseline and alerts only on sustained deviation.
NVIDIA Omniverse
Pinpoints the affected component on an interactive 3D vehicle model.
Many vendors can plot trucks on a map. Far fewer can keep a digital twin in logistics accurate across mixed fleets and busy hubs. We recommend checking five things.
Our experience is that explainability decides adoption. That is why every alert in a digital twin in logistics we build shows its evidence and confidence.
Telematics data reveals where vehicles and drivers are at every moment. We handle it under ISO 9001 and ISO 27001 certified processes, with role-based access and full audit logs.
Location detail can be reduced or delayed for roles that do not need it. Your data stays in your cloud tenancy. Every fault event is stored with a timestamp and sensor snapshot to support maintenance records and warranty claims.
Start with the full cost of one roadside breakdown: towing, repair, the rescue vehicle and the failed deliveries. Multiply it by last year's breakdowns. That is the ceiling your digital twin in logistics works against.
Then add avoided cold chain claims, fewer overtime shifts at peak and lower spare parts stock. We agree these baselines in discovery, so results are measured against your own operational numbers.
Technology stack
We choose tools per network. These are the layers we most often assemble for a digital twin in logistics.
Vehicle & Site Data
SAE J1939OBD-IIGPS telematicsRFID & barcode
Data Fabric
Real-time streamingTime-series storageEdge buffering
Physics & Simulation
CARLAOpenModelica FMUDiscrete-event hub models
AI / ML
XGBoostRule enginesAnomaly detectionMLOps retraining
3D & Visualisation
Dispatcher dashboardsYard maps
Operations Integration
TMSWMSFleet maintenance systemsShipper portals
 Free white paper · Digital TwinThe Industrial Digital Twin PlaybookA practical, vendor-neutral guide to taking an industrial digital twin from first idea to a production system your operators trust.Get the white paper →
 Free white paper · LogisticsTransportation & Logistics Technology SolutionsTransforming Modern Supply Chains with AI, Cloud, and IoT IntegrationGet the white paper →
It monitors whatever your vehicles and sites already report. Typical signals are coolant temperature, oil pressure, fuel use, reefer temperature, scan events and dock status. A digital twin in logistics compares them with expected behaviour to catch drift early.
Usually not. Most modern fleets already stream enough engine and GPS data. Discovery shows where extra sensors, such as reefer probes, would sharpen predictions. We add them only where they pay back.
It uses a physics baseline for the current route and load, then requires signs to persist. In our vehicle health proof of concept, a fault was confirmed only when two signals were present and sustained.
Yes. The same platform can model sorters, docks and pick zones. Many operators start with a fleet twin and later add their busiest hub.
It reads from telematics platforms, WMS and TMS, and writes back route swaps, wave changes and workshop bookings. Custom APIs are scoped during architecture design for in-house systems.
Most projects reach production in eight to sixteen weeks. A proof of concept on one vehicle type or one hub runs in weeks four to six, using your real data.
A digital twin in logistics turns scattered telemetry into foresight. It shows which truck is about to fail, where the hub will jam at peak and how one late linehaul affects the whole day.
ICANIO combines telematics integration, physics models and predictive AI in one delivery team. We take a digital twin in logistics from discovery to production in eight to sixteen weeks, then keep it accurate as your network grows.
By ICANIO Digital Twin Engineering Team · Published · Updated
Book a free 30-minute discovery call with our digital twin engineers. We will map your vehicles, sites and data feeds to a scoped twin with clear milestones. Contact us to get started.
Contact Our Digital Twin Team