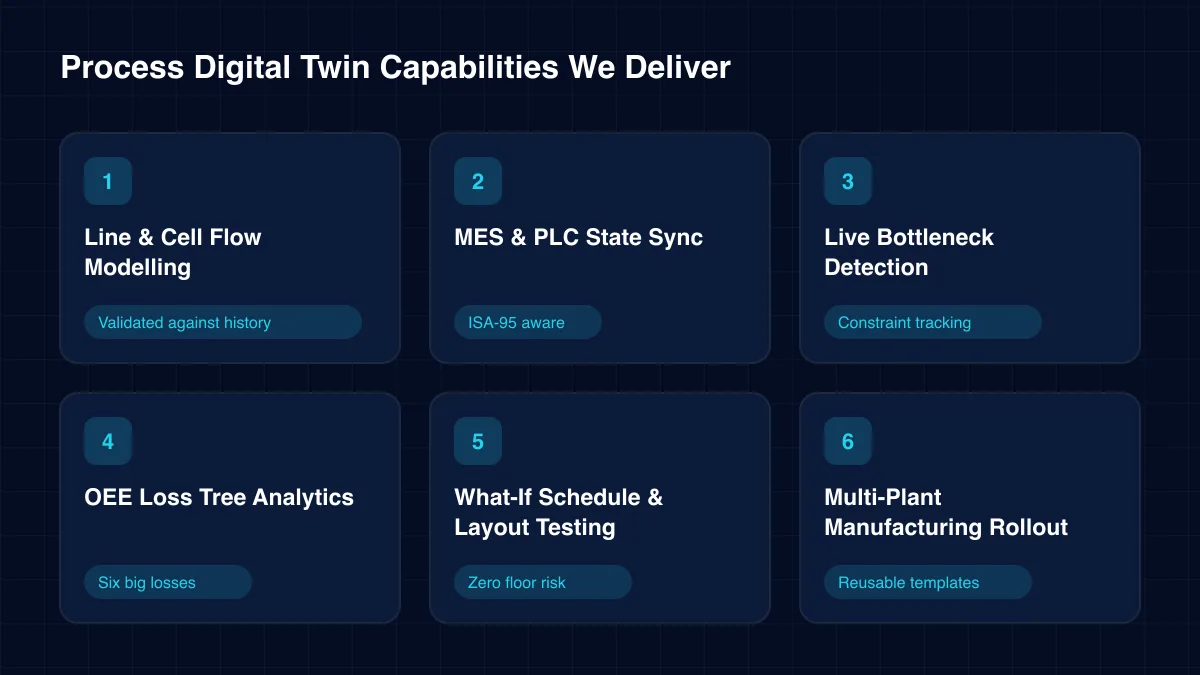
Line & Cell Flow Modelling
We map stations, buffers and routings into a discrete-event model. The process digital twin then reproduces your real cycle times and queue behaviour.
Validated against history
Specialist Digital Twin Service
We model your production flow from raw material to finished goods, connect it to MES and PLC data, and show where throughput is really lost.
Filling Line L-4
Plant 3 · Bottling hall
Remaining life
212 days
Throughput
241u/min
Buffer level
54%
OEE
77.7%
✓ All signals within physics baseline
A process digital twin shows how material, people and machines actually move through your plant, minute by minute. It is built for one question above all: where is throughput lost, and what change will win it back?
Most plants already have dashboards for each machine. Few can see how a short stop at one station starves the next three. Planners guess at bottlenecks, run trials on live shifts and hope the change sticks.
Our team connects MES events, PLC states and order data to a flow model of your line. The model mirrors the current shift, then lets engineers try new settings without risking a single unit of output.
A process digital twin is a live model of a workflow rather than a single machine. It represents stations, buffers, conveyors, changeovers, labour and routing rules. Real event data keeps it in step with the floor.
Unlike a one-off simulation study, it does not go stale after the consultant leaves. Each new order, stop and reject updates the model. Its forecasts stay grounded in how the line runs today.
Engineers use it in two modes. In monitoring mode it explains losses as they happen. In planning mode it runs what-if scenarios on a copy of the current state.
The same model serves several teams. Production uses it to recover lost minutes during the shift. Planning uses it to test next week's schedule. Engineering uses it to size a new conveyor or buffer before any purchase order is raised.
Working definition
“A process digital twin is a data-synchronised model of a production or operational flow that tracks its live state, explains throughput losses and evaluates changes before they reach the physical process.”
Foundations
Stations, buffers, routings and shift patterns are captured as a discrete-event model. It reproduces how work queues and waits.
MES transactions and PLC machine states update the model continuously. Its starting point is always the real current shift.
Every minute of lost output is assigned to a cause: breakdown, starvation, blocking, changeover, speed loss or quality.
Copies of the live state run forward under new rules. Teams compare outcomes side by side before changing anything.
Core capabilities
Pick a single capability for a quick win, or combine them into a plant-wide programme.
We map stations, buffers and routings into a discrete-event model. The process digital twin then reproduces your real cycle times and queue behaviour.
Validated against history
Machine states, counts and order events arrive through OPC UA, MQTT or MES APIs. They keep the model aligned with the current shift.
ISA-95 aware →Starvation and blocking patterns reveal the true constraint. The process digital twin flags when that constraint shifts between stations.
Constraint tracking
Availability, performance and quality losses roll up from machine to line to plant. Engineers drill from a red number to its root cause.
Six big losses
Try new sequences, crew plans, buffer sizes or a new machine on the twin first. Results show the throughput and WIP impact of each option.
Zero floor risk →Once one line is proven, the process digital twin template extends to sister lines and plants. Shared models make cross-site comparison fair. Each site still keeps its own routings, crews and product mix.
Reusable templates →Architecture
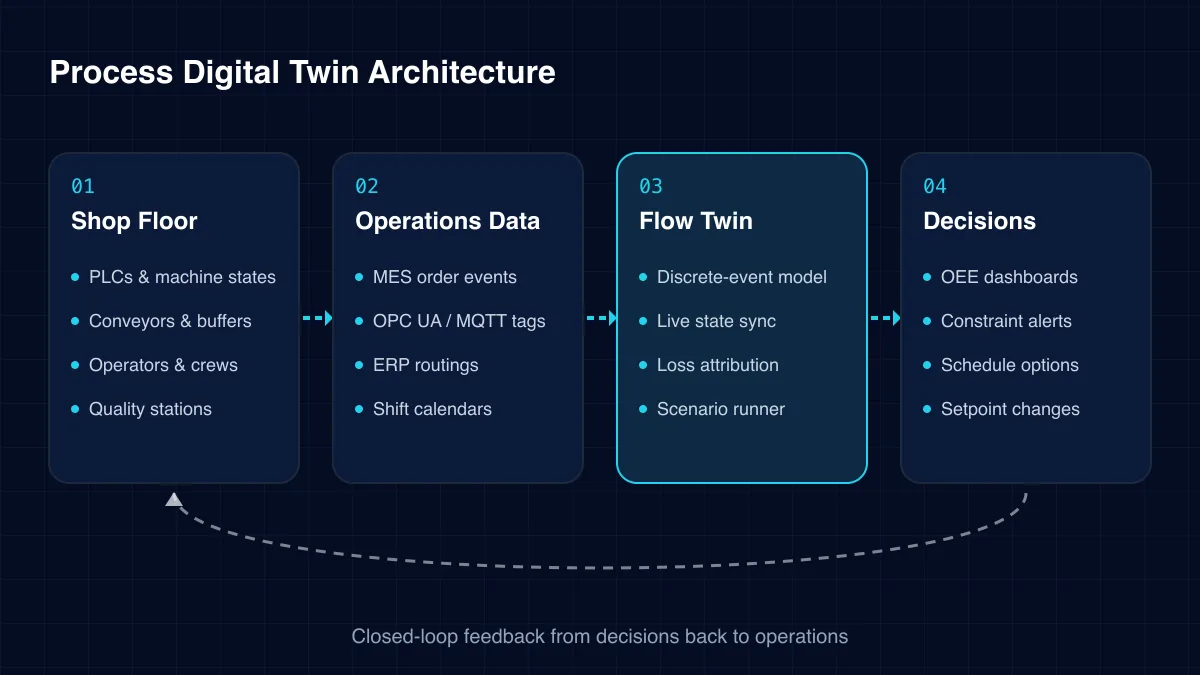
The architecture separates live state from scenario runs. Planners can explore options without disturbing the monitoring view.
01
02
03
04
Challenges we solve
These issues hide in plain sight on most lines because each machine dashboard looks fine on its own.
The constraint moves with product mix and staffing. Fixing yesterday's bottleneck often just shifts the queue somewhere else.
Stops of a few seconds rarely reach a downtime report. Added up across a shift, they can quietly cap output.
Testing a new sequence on the real line costs output and goodwill. A failed trial makes the next idea harder to approve. Good ideas then die unproven, and the line stays as it is.
Long or poorly sequenced changeovers eat capacity. Teams struggle to see which product order would cut them.
Large buffers hide problems and tie up cash. Without a model, nobody knows how small they can safely be. The process digital twin tests smaller buffers against real variability first.
A new machine at the wrong station adds cost without adding output. Investment cases need evidence from the flow.
Scope grows with confidence. Most clients start with one line and expand.
Each tool answers a different question. The table shows how a process digital twin compares.
| Question | OEE dashboard | Simulation study | Process twin |
|---|---|---|---|
| Uses live shop-floor data | ✓ Yes | No | ✓ Yes |
| Explains why output was lost | Partial | No | ✓ Yes |
| Tests changes before rollout | No | ✓ Yes | ✓ Yes |
| Stays current after the study | ✓ Yes | No | ✓ Yes |
| Tracks a moving bottleneck | No | Partial | ✓ Yes |
Gains come from seeing the whole flow at once, then acting on evidence.
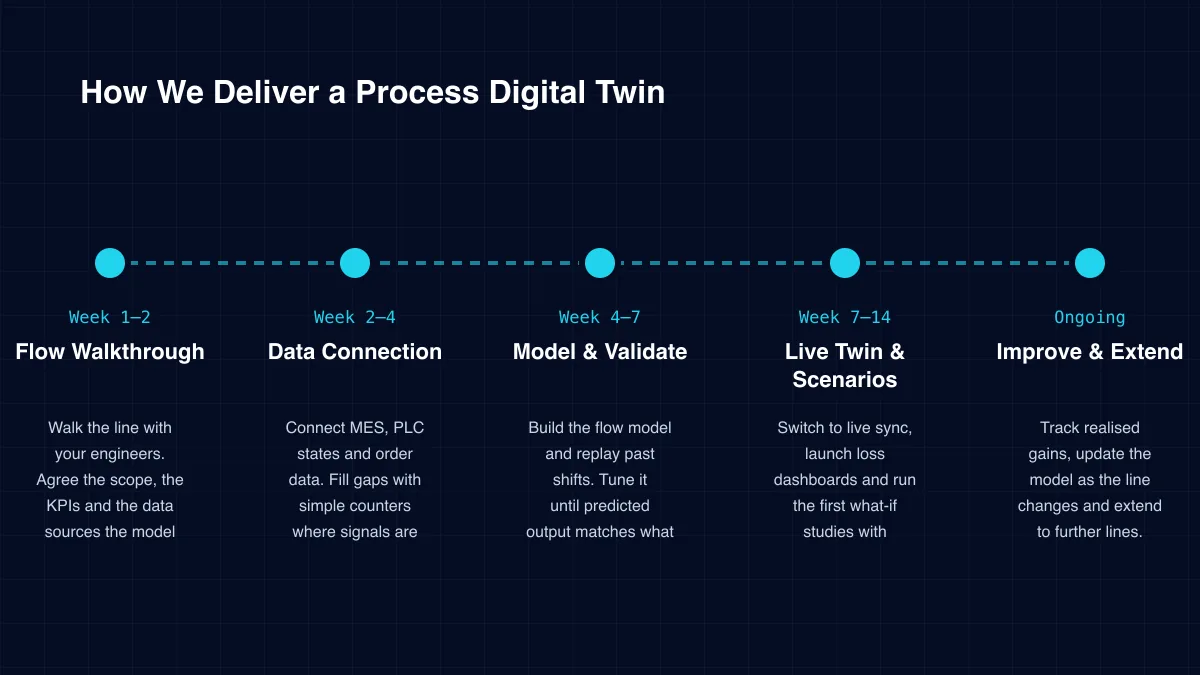
Delivery
Week 1–2
Walk the line with your engineers. Agree the scope, the KPIs and the data sources the model needs.
Week 2–4
Connect MES, PLC states and order data. Fill gaps with simple counters where signals are missing.
Week 4–7
Build the flow model and replay past shifts. Tune it until predicted output matches what really happened.
Week 7–14
Switch to live sync, launch loss dashboards and run the first what-if studies with planners.
Ongoing
Track realised gains, update the model as the line changes and extend to further lines.
Specialist services within our digital twin solutions practice.
Animation is cheap. Validated flow models are not. We recommend checking these five points.
In our experience, the validation step decides whether planners trust the twin, so we never skip it.
Production data shows your capacity and costs, so it needs strong protection. ICANIO works under ISO 9001 and ISO 27001 certified processes.
We respect OT network zoning and use read-only connections by default. Setpoint write-back is optional, role-controlled and logged. Models can run on premises or in your own cloud tenancy.
We also keep scenario data apart from live data. A planner can explore a radical what-if without any risk that it leaks into production systems. Every scenario run is stored with its author, inputs and results for later review.
Start with the margin on one extra unit of output and the hours your constraint loses each week. Their product is the value of every hour won back. A process digital twin targets exactly those hours.
Add WIP reduction, avoided trial costs and better capex decisions. We baseline each one with you during discovery and report against it after go-live.
We recommend tracking realised gains monthly rather than once. A process digital twin keeps paying back only while teams keep using it, so adoption is measured alongside output.
Technology stack
We fit the stack to your plant systems. These are common choices.
Shop Floor
PLCsSCADAMachine countersQuality gauges
Connectivity
OPC UAMES APIsISA-95 models
Modelling
Discrete-event simulationSimPyContinuous process models
Data
Time-series storeEvent streamingCloud data lake
Analytics
OEE loss treesMachine learning forecastsConstraint detection
Enterprise
MESERP routingsPlanner dashboardsSSO access
An asset twin watches the health of one machine. A process digital twin models how work flows between many machines, buffers and people. It explains output, not wear. Many plants run both, with asset health alerts feeding the flow model as planned downtime.
At minimum, machine states, part counts, order events and shift patterns. Most of this already sits in MES or PLCs. We add simple counters where a station is invisible today.
Yes. Discrete lines use event-based models. Batch and continuous plants use recipe states, tank levels and flow rates instead. The approach changes, but the goal stays the same.
We replay past shifts through the model and compare predicted output with actual output. The process digital twin goes live only after your engineers accept that comparison.
Only if you want it to. By default it recommends changes for a person to approve. Automated write-back is an option with roles, limits and full logging.
The first validated line model usually lands within seven weeks. Live monitoring and what-if studies follow in the weeks after that. Planners usually run their first real scenario before the full rollout ends.
How we deliver process digital twin and the wider digital twin practice in each sector.
A process digital twin turns scattered machine data into a clear picture of the whole flow. It shows where output goes missing and which change will bring it back.
ICANIO combines flow modelling, shop-floor integration and analytics in one team. We prove the model on one line, then help you scale it across your manufacturing network.
By ICANIO Digital Twin Engineering Team · Published · Updated
Book a free discovery call with our process twin engineers. We will review one line with you and outline a model, a data plan and clear milestones.
Contact Our Digital Twin Team