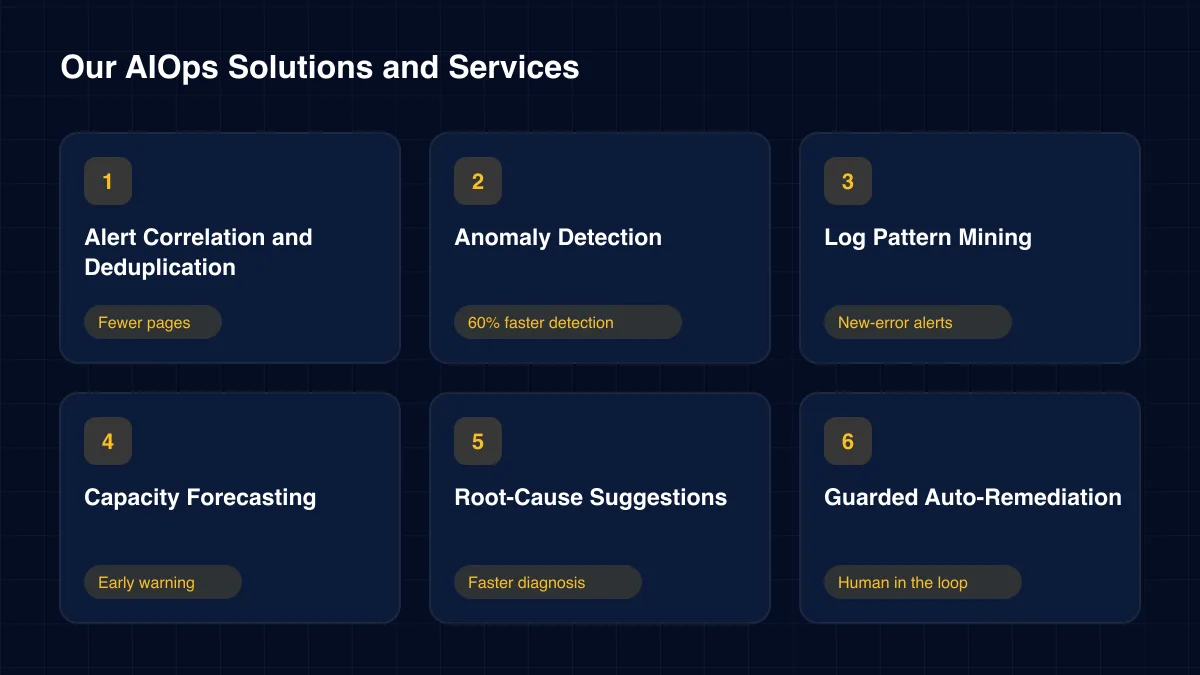
Alert Correlation and Deduplication
Alerts are grouped by time window, shared labels and service dependencies. With our AIOps solutions, one root failure appears as one incident with its related symptoms attached.
Fewer pages
AIOps Solutions
Machine learning groups related alerts, spots unusual behaviour early and points engineers to the likely cause. Humans stay in charge of every fix.
128
Resolved today
100%
Within SLA
24/7
On shift
AIOps solutions use machine learning to make sense of operations data at a scale people cannot handle alone. They read metrics, logs, traces and alerts, then surface the few signals that matter. Engineers spend less time sorting noise and more time fixing real problems.
Modern platforms create a flood of telemetry. One database failover can trigger dozens of alerts across services that depend on it. A slow memory leak hides inside normal daily swings. Static thresholds either fire too often or not at all.
This page explains what AIOps solutions do, where they help and where they do not. It covers correlation, anomaly detection, forecasting and safe automation. It also shows how threshold plus anomaly-based alerting helped one ICANIO partner reach 99.9% uptime with 60% faster detection.
AIOps stands for artificial intelligence for IT operations. Gartner coined the term to describe platforms that combine big data and machine learning to automate operations work. Today it covers a family of techniques rather than one product.
The most common technique is event correlation. Related alerts are grouped by time, topology and text, so one failure becomes one incident instead of fifty pages. The second is anomaly detection, which learns normal behaviour and flags departures, including seasonal patterns.
Other techniques include log pattern mining, capacity forecasting and suggested root causes. Mature setups also trigger runbooks automatically, usually with a human approval step for anything risky.
AIOps solutions are not magic. They depend on clean, well-labelled telemetry and on a team that tunes the models. The value comes from pairing good data with good operations practice, not from switching on a tool.
Industry context shapes the design. A retail platform sees huge peaks during sales. A fintech service runs heavy batch jobs at month end. Manufacturing systems link IoT gateways and plant servers. AIOps solutions must learn these rhythms, or they will flag normal busy periods as anomalies.
Working definition
“AIOps solutions apply machine learning and analytics to operations data, such as metrics, logs, traces and events, to reduce noise, detect problems early and speed up diagnosis and response.”
Foundations
Consistent labels, service names and timestamps make every model more accurate.
A map of dependencies lets correlation link a symptom to its upstream cause.
Engineers see why alerts were grouped or flagged, so they can trust or correct it.
Automation proposes, people approve. Risky actions never run unchecked.
Core capabilities
Our AIOps solutions start with the problem you feel most, usually alert noise, and expand from there.
Alerts are grouped by time window, shared labels and service dependencies. With our AIOps solutions, one root failure appears as one incident with its related symptoms attached.
Fewer pages
Models learn daily and weekly patterns for key metrics. On a DevOps observability platform, adding anomaly-based alerts to thresholds gave 60% faster incident detection.
60% faster detection →Log lines are clustered into templates, so new or rising error patterns stand out after a release. Engineers see what changed without reading thousands of lines.
New-error alerts
Time-series forecasts warn when disks, queues or connection pools will run out. Teams act days ahead instead of during an outage.
Early warning →Correlated events, recent deploys and config changes are ranked as likely causes. AIOps solutions shorten the search, while engineers confirm the answer.
Faster diagnosis
Known fixes, such as restarting a stuck worker, run from tested runbooks after approval. This sits inside our wider support engineering services.
Human in the loop →Architecture
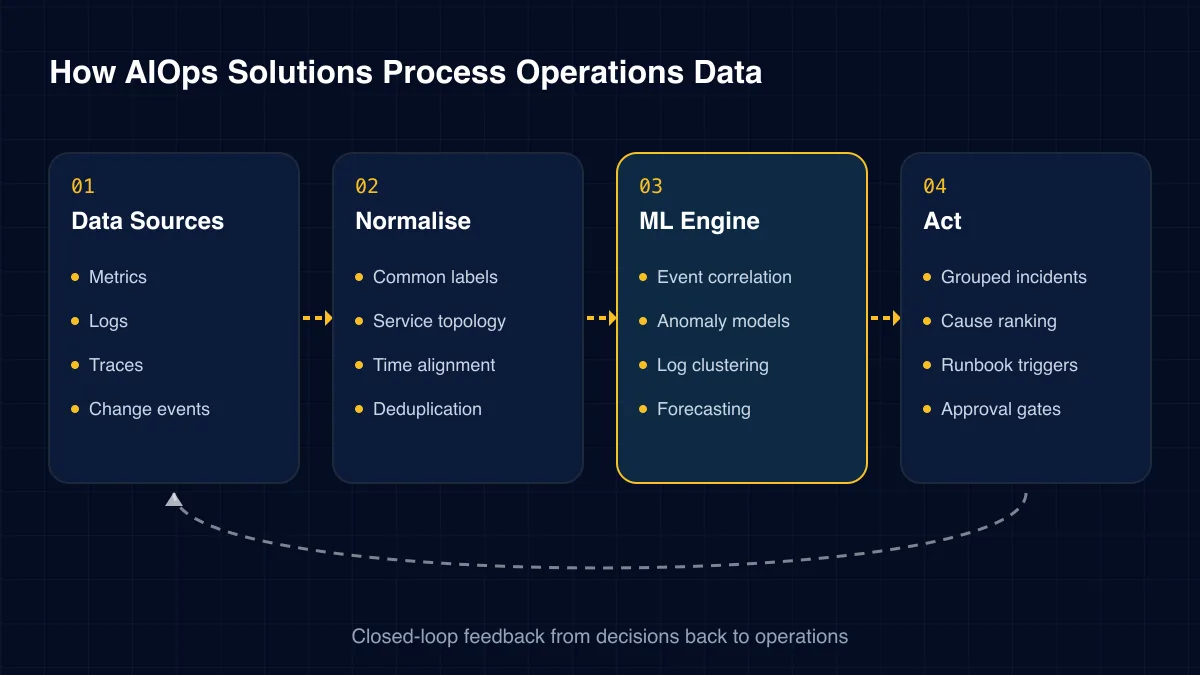
Our AIOps solutions follow a four-layer flow. Raw telemetry is normalised, models analyse it, and the results feed the people and tools that respond.
01
02
03
04
Challenges we solve
These issues grow with every new service and every new tool. Rules alone stop scaling.
One failure fans out into dozens of alerts. On-call engineers waste the first minutes working out what is actually broken.
Traffic swings by hour and season. A fixed limit is too tight at night and too loose at peak.
Memory and disk creep slowly. Nothing crosses a threshold until the service falls over.
A new error after a release hides among millions of normal lines. It is found only after users complain.
Each tool raises its own alerts with its own format. Nobody sees the joined-up picture.
Engineers run the same restart or cleanup every week. The work is dull and easy to get wrong at 3 a.m.
There are four broad ways to adopt AIOps. Many teams combine two of them.
AIOps adds learning on top of rules. It rarely replaces them entirely.
| Capability | Static rules | Commercial AIOps tool | ICANIO AIOps service |
|---|---|---|---|
| Seasonal anomaly detection | No | ✓ Yes | ✓ Yes |
| Cross-tool correlation | No | Partial | ✓ Yes |
| Tuned to your topology | Partial | Partial | ✓ Yes |
| Explainable groupings | ✓ Yes | Partial | ✓ Yes |
| 24/7 human follow-up | No | No | ✓ Yes |
The benefits build as the models learn your platform and your team trusts the output.
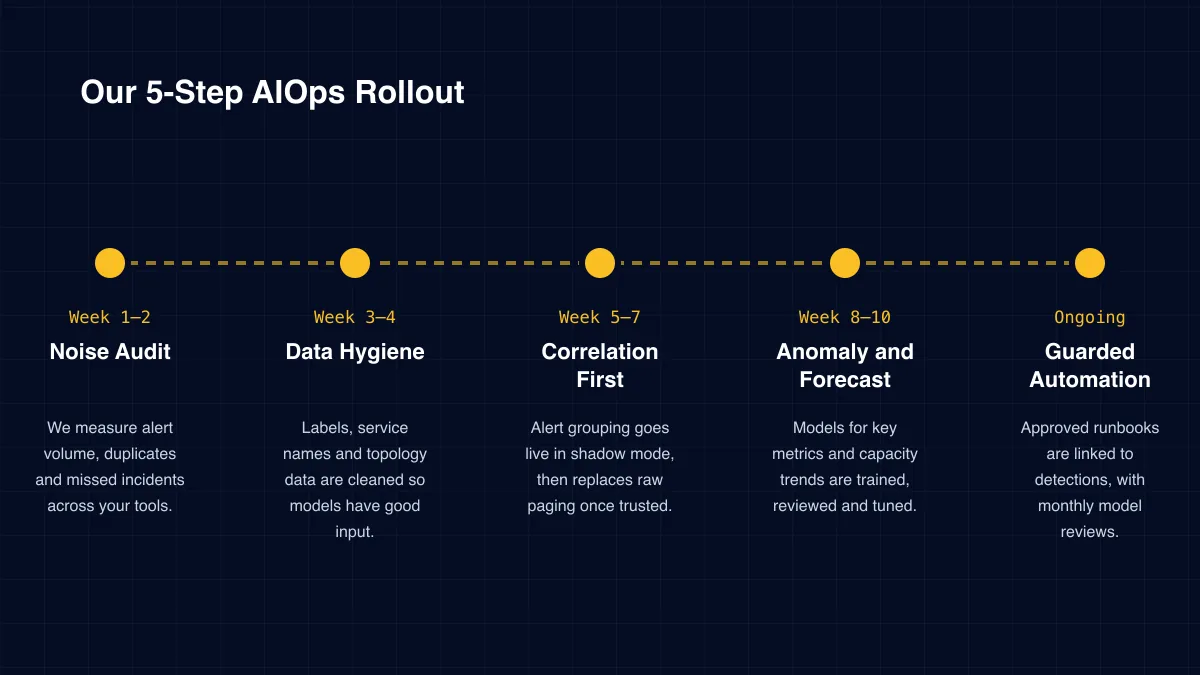
Delivery
Week 1–2
We measure alert volume, duplicates and missed incidents across your tools.
Week 3–4
Labels, service names and topology data are cleaned so models have good input.
Week 5–7
Alert grouping goes live in shadow mode, then replaces raw paging once trusted.
Week 8–10
Models for key metrics and capacity trends are trained, reviewed and tuned.
Ongoing
Approved runbooks are linked to detections, with monthly model reviews.
Case study
A partner relied on ad hoc alerts that gave little actionable insight and struggled to meet uptime and SLA commitments. ICANIO built a centralised observability stack and added threshold and anomaly-based alerts, so problems fixed thresholds would miss were caught early. Automated health checks fed capacity planning. The platform delivered 99.9% uptime stability, 60% faster incident detection and response, and 40% less downtime risk exposure.
Read the full case study →Metrics, logs and alerts
One stack gave models and people the same picture.
Threshold plus anomaly rules
Unusual behaviour was flagged before limits were crossed.
Automated health checks
Trend data guided scaling ahead of demand.
Specialist services within our technical support engineering practice.
AIOps is full of bold claims. We recommend testing five points before you buy.
The best AIOps solutions are quietly useful. They reduce noise, add context and leave decisions with engineers. That is how our team builds them.
Operations data can contain user IDs, IP addresses and sometimes secrets. We scrub sensitive fields before data reaches any model and keep training data inside your cloud account where possible.
ICANIO works under ISO 9001 and ISO 27001 certified processes. Model access is role-based, and any automated action is logged with the detection that triggered it and the person who approved it.
If you use a third-party AIOps product, we review where its data is stored and processed. That check matters for GDPR, HIPAA and financial services rules.
Models themselves need governance. We version every model, record the data it was trained on and keep a rollback path. If AIOps solutions start grouping alerts badly after a platform change, the previous version can be restored in minutes.
Start with a baseline: pages per week, duplicate alerts, mean time to detect and incidents found by customers first. AIOps solutions should move all four in the right direction.
Then track engineer time. Fewer pages and faster diagnosis free hours each week. Price those hours honestly and compare them with tool and service costs.
Finally, count avoided outages. Each capacity forecast that prompts early action is an incident that never happened. Log these, because they are easy to forget when nothing breaks.
Report the results monthly in plain language. Leaders should see pages saved, incidents caught early and hours returned to engineering. Clear reporting keeps AIOps solutions funded and focused on real outcomes.
Technology stack
We build on open telemetry standards and integrate with commercial AIOps features you already own.
Telemetry
Storage
ClickHouse
Machine Learning
Prophet
Correlation
Alertmanager groupingCustom rules engine
Visualisation
Automation
Rundeck
Most teams start with alert noise. AIOps solutions group related alerts into one incident, which cuts pages and helps on-call engineers see the real fault faster.
No. They sit on top of your monitoring, logging and tracing tools. Good telemetry is the input, and AIOps adds correlation, anomaly detection and context.
Anomaly models usually need a few weeks of history to learn daily and weekly patterns. Correlation can start sooner because it relies on topology and timing as well as history.
Only where you allow it. We link known, low-risk fixes to tested runbooks with approval gates. Anything risky stays with an engineer.
New models run in shadow mode first. Engineers mark results as right or wrong, and we tune sensitivity until the output earns trust.
No. Mid-sized teams often gain the most, because they have growing alert volumes but few people to handle them. We size AIOps solutions to your estate.
How we deliver aiops solutions and the wider support engineering practice in each sector.
Operations data keeps growing faster than teams do. AIOps solutions close that gap by sorting, linking and forecasting signals so people can focus on judgement and repair.
ICANIO brings data hygiene, practical machine learning and 24/7 operations under one roof. The same skills that power predictive maintenance in manufacturing apply to servers, queues and databases. Contact us to run a noise audit and see where AIOps solutions would help most.
Start small and prove value. A single correlation rule set on your noisiest service can show results within weeks. From there, anomaly models, forecasts and guarded automation can follow at a pace your team trusts.
By ICANIO Support Engineering Team · Published · Updated
Book a free discovery call. We will review your alert volume and tooling, then show where correlation and anomaly detection would help first.
Contact Our AIOps Team