
OBSERVABILITY STACK · INCIDENT RESPONSE · SLA MONITORING
This DevOps observability platform consolidates metrics, alerts, and dashboards, improving reliability, uptime, and operational visibility across cloud applications and managed services.
Quick Answer
What Is a DevOps Observability Platform?
A DevOps observability platform consolidates metrics, logs, and alerts into one centralized stack, replacing ad hoc monitoring with proactive, actionable visibility into system health. ICANIO built this DevOps observability platform to deliver 99.9% reliability and uptime stability with 60% faster incident detection and response.
Executive Summary
Turning Reactive Alerting Into Proactive Observability
Engineering teams lacked unified monitoring, limiting proactive issue detection and visibility. Ad hoc systems could not support growing workloads, performance expectations, or uptime commitments across AI-driven solutions. ICANIO’s partner was facing exactly that gap: no centralized monitoring that made issue detection slow and reactive, ad hoc alerts that failed to provide actionable performance insights, limited visibility that caused delays in identifying infrastructure bottlenecks, and teams struggling to maintain uptime and meet SLA commitments.
ICANIO addressed this by implementing a unified observability platform rather than another point monitoring tool. The objective was to consolidate metrics, logs, and alerts into a centralized observability stack, add threshold and anomaly-based alerts for rapid incident response, build dashboards giving engineers and managers real-time system health views, automate health checks to inform capacity planning and scaling decisions, and layer in monitoring signals to improve stability for growing cloud workloads.
The result was 99.9% system reliability and uptime stability, with 60% faster incident detection and response, enhanced operational visibility, a 40% reduction in downtime risk exposure, optimized infrastructure cost efficiency, and a scalable monitoring platform architecture.
“A monitoring system that only tells you something broke after a customer already noticed is not observability, it is a very expensive notification.”
The Challenge
Five Gaps in Reactive Infrastructure Monitoring
Engineering teams lacked unified monitoring, limiting proactive issue detection and visibility. Ad hoc systems could not support growing workloads, performance expectations, or uptime commitments across AI-driven solutions.
The DevOps Observability Platform Gap
No centralized monitoring made issue detection slow and reactive, leaving teams responding to problems only after they had already grown.
Ad Hoc Alerts Lacked Actionable Insight
Ad hoc alerts failed to provide actionable performance insights, so notifications rarely told the team what to actually do next.
Limited Visibility Delayed Bottleneck Detection
Limited visibility caused delays in identifying infrastructure bottlenecks, extending how long a performance issue could quietly persist.
Struggling to Meet Uptime and SLA Commitments
Teams struggled to maintain uptime and meet SLA commitments, putting both customer trust and contractual obligations at risk.
Why This DevOps Observability Platform Was Needed
Scaling decisions lacked accurate monitoring data for guidance, and leadership lacked dashboards to track system health and performance on top of that.
DevOps Observability Platform Solutions Provided
A Six-Part DevOps Observability Platform
Icanio implemented a unified observability platform with proactive alerts, automated health checks, role-based dashboards, and scaling signals, enabling faster incident response, operational insight, and improved service reliability. The solutions included:
The DevOps Observability Platform Core
A centralized observability stack consolidated metrics, logs, and alerts, replacing scattered monitoring tools with one unified view.
Threshold and Anomaly-Based Alerts
Threshold and anomaly-based alerts enabled rapid incident response, catching problems that fixed thresholds alone would have missed.
Real-Time System Health Dashboards
Dashboards provided engineers and managers real-time system health views, giving every level of the organization the same shared picture.
Automated Capacity Planning Health Checks
Automated health checks informed capacity planning and scaling decisions, replacing guesswork with actual usage data.
Stability Signals for Growing Workloads
Monitoring signals improved stability for growing cloud workloads, catching strain before it turned into an outage.
This DevOps Observability Platform's Reliability
The platform ensured consistent reliability and uptime across services, so no single component became the weak link.
Business Outcomes
Measurable Results Across Uptime, Speed, and Visibility
This DevOps observability platform delivered outcomes across every dimension of the original reactive-monitoring problem, converting scattered alerts into fast, proactive, and reliable operational visibility.
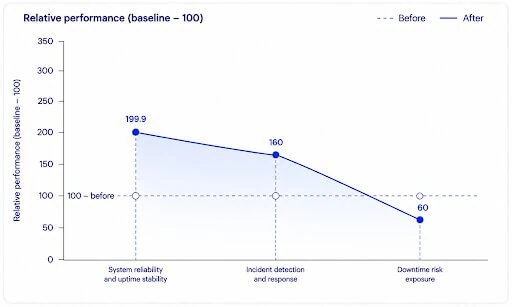
DevOps observability platform outcomes: 99.9% system reliability, 60% faster incident detection and response, and 40% lower downtime risk exposure.
99.9%System
Reliability and uptime stability
60%Faster
Incident detection and response
Enhanced
Operational visibility insights
40%Reduced
Downtime risk exposure
Optimized
Infrastructure cost efficiency
Scalable
Monitoring platform architecture
Key learnings
What This Engagement Proves for Growing Cloud Operations Teams
This DevOps Observability Platform Catches What Thresholds Miss
Ad hoc alerts based on fixed thresholds alone were failing to provide actionable insight. Adding anomaly-based alerts alongside threshold alerts is what let the team catch the subtler problems that a static rule would never trigger on.
Dashboards Only Help If Every Level of the Organization Uses Them
Leadership previously lacked dashboards to track system health, while engineers had their own disconnected views. Building shared, real-time dashboards for both audiences is what turned monitoring data into decisions leadership could actually act on.
This DevOps Observability Platform Needs Real Data
Scaling decisions lacked accurate monitoring data for guidance before this engagement, forcing teams to estimate capacity needs. Automated health checks feeding real usage data into capacity planning is what made scaling decisions reliable instead of reactive.
Conclusion
From Reactive Alerts to Proactive Observability
Ad hoc monitoring and reactive alerting might have been workable for a small, stable workload, but for engineering teams supporting growing, AI-driven cloud applications, it had become a real risk to uptime and SLA commitments. This engagement demonstrates that a single DevOps observability platform can resolve visibility, incident response, and scaling gaps within one structured programme rather than three separate initiatives.
By consolidating metrics, logs, and alerts into cloud monitoring services, enforcing SLA compliance through anomaly-based alerting, and standardizing incident response across every dashboard and metrics dashboard view, ICANIO helped this partner reach 99.9% system reliability and 60% faster incident detection. The scalability monitoring and cloud reliability delivered through this engagement are the foundation every future workload this platform supports will run on.
Related Resources
This DevOps observability platform belongs to ICANIO's DevOps and cloud engineering services. Our team pairs monitoring with deployment automation so software development teams see issues early. Round-the-clock follow-up on alerts is covered by our support engineering services. More examples sit in our software development case studies. To plan a similar monitoring stack, contact ICANIO.
- DevOps and Cloud Engineering Services
- Industries We Serve
- Best Infrastructure Monitoring Platform: 99.9% Uptime
- DevOps API Support Platform: 3x Faster
- Structured Logging and Production Observability
References
- Monitoring Distributed Systems: Google's SRE book chapter on alerting and monitoring signals.
- Observability primer: OpenTelemetry's introduction to metrics, logs and traces.
- Anomaly detection: methods for spotting data points that deviate from normal behaviour.
- Service-level agreement: how SLAs define uptime and service commitments.
Frequently asked questions
Common Questions About This DevOps Observability Platform
What is a DevOps observability platform and why use one?
A DevOps observability platform consolidates metrics, logs, and alerts into one centralized stack, replacing ad hoc monitoring that made issue detection slow, reactive, and hard to act on.
How do cloud monitoring services improve incident detection speed?
Cloud monitoring services combine threshold and anomaly-based alerts to catch infrastructure issues as they emerge, which is what cut incident detection and response time by 60% in this engagement.
How does this platform help teams maintain SLA compliance?
SLA compliance improves when teams have real-time dashboards and proactive alerts showing system health continuously, instead of discovering an SLA breach only after a customer reports it.
What role does incident response automation play in this platform?
Incident response is accelerated by threshold and anomaly-based alerts that trigger automatically, giving engineers a head start on diagnosis instead of waiting for manual detection.
Who actually uses the metrics dashboard this platform provides?
The metrics dashboard gives both engineers and managers real-time system health views, so technical and leadership audiences work from the same operational picture.
How reliable is uptime with this DevOps observability platform?
This DevOps observability platform delivers 99.9% system reliability and uptime stability, with a 40% reduction in downtime risk exposure compared to ad hoc monitoring.