
Executive and Operational Dashboards
Business intelligence services for leadership, finance, sales and operations dashboards in Power BI, Tableau, Looker or Apache Superset. Each one is built around agreed KPIs.
KPI-first design →Data & AI · Business Intelligence
ICANIO builds live dashboards, governed metrics and automated reports. Leaders see one version of the numbers every morning, and analysts stop rebuilding the same workbook each week.
Daily refresh: orders, returns, targets
Load
Model
Compare
Publish
⟳ Model running…
Business intelligence services start with a simple promise: the right people see the right numbers without asking for them. In many firms that is not true yet. Reports live in spreadsheets, figures arrive late and two departments quote different totals for the same month.
Our team fixes the whole chain. We connect sources, model data into clear facts and dimensions, define each metric once and publish dashboards that refresh on their own. Then we train people to use them, so the old workbooks can finally be retired.
This guide explains what modern BI covers, the platforms we use, the traps to avoid and how to pick a partner. It includes a real ICANIO build that replaced spreadsheet-driven operations with real-time dashboards for a wealth advisory firm.
Business intelligence services design, build and run the systems that turn operational data into reports, dashboards and alerts. They cover data modelling, metric definitions, visual design, access control, report automation and user enablement.
BI answers 'what happened' and 'why'. Revenue by region, margin by product and on-time delivery by carrier are typical questions. Good BI makes those answers fast, consistent and self-service.
It also sets the stage for prediction. Once metrics are trusted and history is clean, forecasts and anomaly alerts from machine learning can sit on the same dashboards. We build with that next step in mind.
Working definition
“Business intelligence services are the design and operation of governed data models, shared metric definitions and automated dashboards that give every team timely, consistent answers about business performance.”
Foundations
Revenue, churn and margin are defined in a semantic layer. Every report reuses the same logic, so totals always agree.
Each dashboard answers specific questions for a named audience. Charts that nobody acts on are removed.
Data loads, validation and distribution run on schedule. Nobody should copy and paste to update a report.
Row-level security shows each user only their region, branch or clients, from a single shared model.
Core capabilities
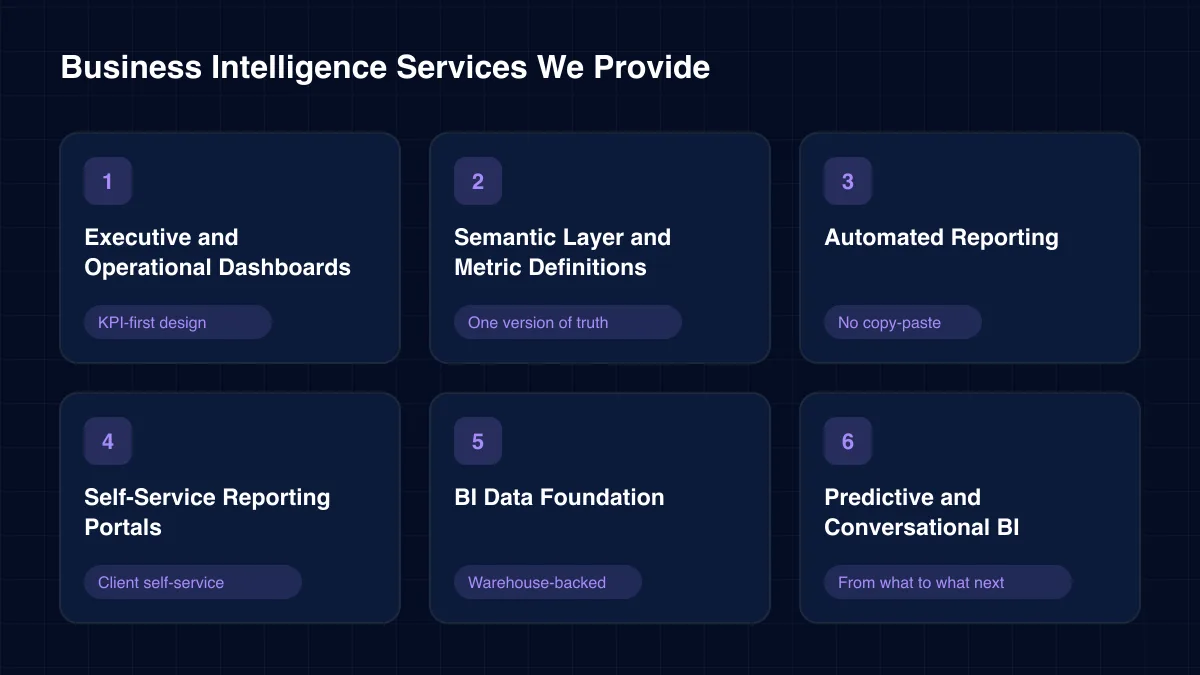
Our business intelligence services cover six areas. Most clients start with one executive dashboard and grow into self-service analytics.
Business intelligence services for leadership, finance, sales and operations dashboards in Power BI, Tableau, Looker or Apache Superset. Each one is built around agreed KPIs.
KPI-first design →Star schemas and a governed metric layer using dbt metrics, Power BI datasets or LookML. One definition of revenue for every team.
One version of truth
Scheduled PDF, Excel and email reports generated from live data. Our CSV parser platform for a wealth partner cut manual effort by 30%.
No copy-paste →Secure client and partner portals with ledgers, statements and drill-downs. Our financial reporting portal cut report retrieval time by 60%.
Client self-service →Pipelines and warehouse models underneath every dashboard. Our business intelligence services build on the same platform as our data engineering work.
Warehouse-backed →Forecasts, anomaly alerts and plain-language questions layered on governed metrics. It brings our wider Data & AI work into everyday reporting.
From what to what next →Architecture
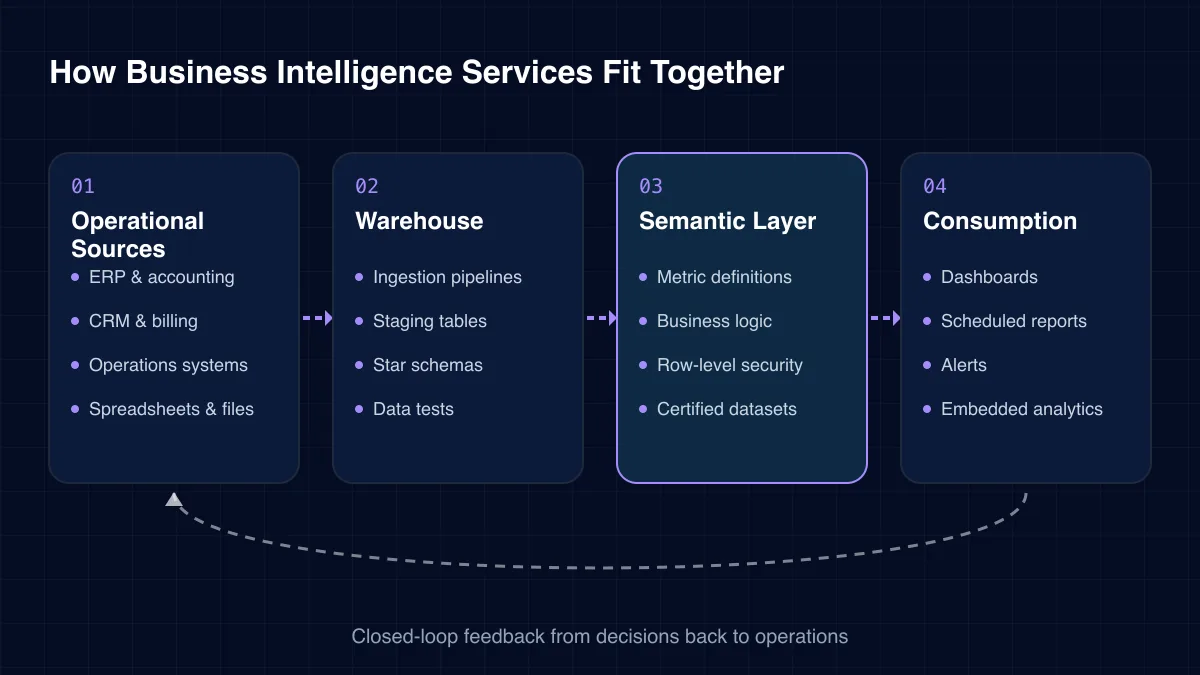
Every BI platform we deliver has four layers. Data flows up from operational systems, and decisions flow back through dashboards and alerts.
01
02
03
04
Challenges we solve
These are the complaints we hear most often from finance, sales and operations leaders.
Analysts spend the start of each week rebuilding the same workbook. Automated refresh gives them that time back.
Sales and finance bring different revenue figures. A shared semantic layer ends the argument.
Hundreds of reports, most unused and many wrong. We audit, certify the useful ones and archive the rest.
Dashboards take a minute to load because they query raw tables. Aggregations and proper models make them fast.
Nobody knows who changed a formula or approved a figure. Version-controlled models and logged access fix that.
Managers wait in a queue for simple cuts of data. Governed self-service lets them explore safely on their own.
Business intelligence services come in four main forms. Each serves a different audience and refresh need.
This table shows how a governed, modern stack compares with the tools most teams start from.
| Criterion | Spreadsheets | Classic BI | Modern BI |
|---|---|---|---|
| Automatic refresh | No | ✓ Yes | ✓ Yes |
| Shared metric definitions | No | Partial | ✓ Yes |
| Self-service exploration | Partial | No | ✓ Yes |
| Version control | No | Partial | ✓ Yes |
| Best for | Ad hoc analysis | Fixed reports | Company-wide KPIs |
The returns come from time saved, faster decisions and fewer arguments about the numbers.
Delivery
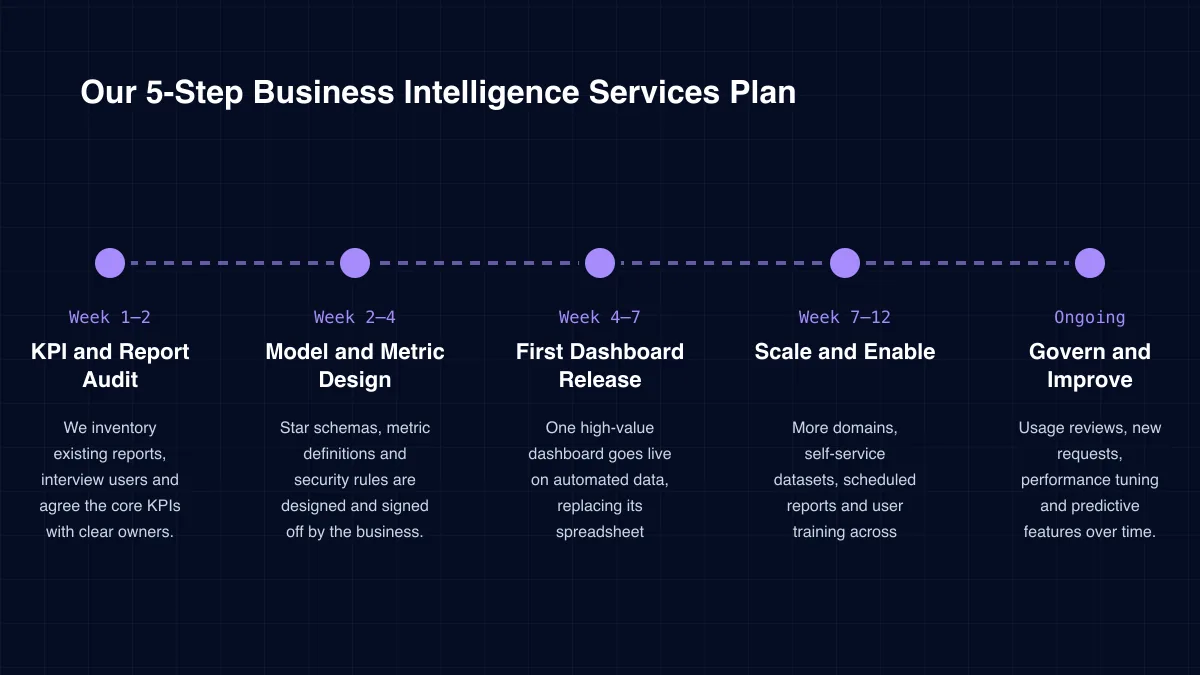
Week 1–2
We inventory existing reports, interview users and agree the core KPIs with clear owners.
Week 2–4
Star schemas, metric definitions and security rules are designed and signed off by the business.
Week 4–7
One high-value dashboard goes live on automated data, replacing its spreadsheet predecessor.
Week 7–12
More domains, self-service datasets, scheduled reports and user training across teams.
Ongoing
Usage reviews, new requests, performance tuning and predictive features over time.
Case study
A wealth advisory firm relied on manual Excel processes that delayed reports, risked calculation errors and left no audit trail. ICANIO built a central workflow console with automated document processing, real-time workflow dashboards, comprehensive audit trails and a validation engine. Advisory team productivity rose by 75%.
“In a regulated advisory practice, a spreadsheet is also the reason there is no audit trail when something goes wrong.”Read the full case study →
Single workflow console
Brings fragmented sources into one place for real-time decisions.
Real-time workflow tracking
Gives managers instant visibility into task progress and accountability.
Audit trails · Validation engine
Catches errors early and records every report and task for compliance.
Specialist services within our data & artificial intelligence practice.
Pretty charts are easy to sell. We recommend checking five deeper skills before you hire anyone.
Our business intelligence services include adoption and governance by default. A dashboard nobody trusts or opens has no value.
ICANIO works under ISO 9001 and ISO 27001 certified processes. BI platforms connect to your warehouse through secure gateways, and credentials stay in managed vaults.
Row-level and object-level security restrict what each user can see. Sensitive fields, such as salaries or client identifiers, are masked or excluded from shared datasets.
Every dataset and report is version-controlled, and access is logged. That supports internal audit, SOX-style financial controls and GDPR obligations for personal data.
Count the hours analysts spend building recurring reports today. Automating them is usually the quickest and most visible saving.
Next, look at decision speed. When month-end packs, sales reviews and stock meetings start with current data, actions happen days earlier. We agree a few measurable examples with you upfront.
Licences and compute are the main running costs. We right-size capacity, use incremental refresh and retire unused content. That keeps business intelligence services affordable as more teams come on board.
We also report on adoption. Weekly active viewers, retired spreadsheets and the share of meetings run from dashboards show whether the investment is changing habits. Those numbers tell you where to train, simplify or expand next.
Technology stack
We work with the BI tools you already license, or recommend one that fits your scale and cloud.
BI Platforms
Microsoft Power BITableauLookerApache Superset
Warehouses
Amazon Redshift
Modelling
dbtSQLStar schemasLookML
Pipelines
Fivetran
Reporting
Paginated reportsExcel automationEmail schedulesEmbedded SDKs
Governance
Row-level securityData catalogsGit version controlUsage analytics
Our business intelligence services include KPI design, data modelling, semantic layers, dashboards, automated reports, self-service datasets, security, training and ongoing support. You can start with a single dashboard.
It depends on your cloud, licences and users. Power BI suits Microsoft estates, Looker suits Google Cloud, and Tableau suits heavy visual analysis. Apache Superset is a strong open-source option. We recommend one after the audit.
A first production dashboard usually goes live in four to seven weeks. Broader rollout across departments typically takes three months, depending on how many sources need modelling.
Most of them, yes. Recurring Excel reports are prime candidates for automation. People can still export to Excel for ad hoc work, but the source becomes the governed model, not a private copy.
Yes, once metrics are trusted. We add forecasts, anomaly alerts and natural-language questions on top of the same semantic layer, so AI answers match the official figures.
We deliver business intelligence services for wealth management and banking, healthcare operations, retail and e-commerce, logistics, and manufacturing teams tracking cloud-connected IoT and production KPIs.
How we deliver business intelligence services and the wider data & ai practice in each sector.
Every business already collects the data it needs to run better. Business intelligence services make that data visible, consistent and timely, so meetings focus on decisions rather than whose spreadsheet is right.
ICANIO designs the model, builds the dashboards and helps your teams adopt them. Contact us to audit your reporting and plan business intelligence services that leaders rely on every day.
By ICANIO Data & AI Engineering Team · Published · Updated
Book a free 30-minute discovery call. We will review your current reports, agree the KPIs that matter and outline a dashboard plan with clear milestones.
Contact Our BI Team