Step-Level Tracing
OpenTelemetry instrumentation that follows GenAI semantic conventions for model and tool spans. AI agent monitoring starts with seeing every step of every run.
Every step
AgenticOps · AI Agent Monitoring
An agent can be up, fast and confidently wrong. We trace every step, score answers in production and track cost per task, so you see quality problems before your customers do.
⟳ Orchestrating agents…
every step traced · guardrails on · reversible
AI agent monitoring is the practice of watching what agents do in production: every reasoning step, tool call, answer, cost and delay. It goes beyond uptime checks, because an agent can respond quickly and still be wrong, slow on one step or quietly expensive.
Our team sets up AI agent monitoring that combines distributed tracing, live quality evaluation, cost tracking and alerting. We use open standards such as OpenTelemetry, so your data is not locked into one vendor's dashboard.
This page covers what to measure, how the monitoring stack fits together, the blind spots we see most and how to turn monitoring data into steady improvement.
Observability in software means understanding a system's internal state from the data it emits: logs, metrics and traces. Agents need all three, plus a fourth signal that classic tools lack. That signal is quality, meaning whether the agent's output was right.
A single agent run can involve a plan, several model calls, retrieval, tool calls and a final answer. AI agent monitoring records each of these as a span in one trace. When a run goes wrong, you can see exactly which step failed and why.
Quality is checked in two ways. Offline evaluation replays golden test cases before release. Online evaluation scores a sample of live runs with automated judges and human review. Both feed the same dashboards.
Cost and latency complete the picture. Token use, tool fees and response times are tracked per agent, per step and per customer. That shows where to optimise and stops surprise bills at the end of the month.
Different sectors stress different signals. Banks watch policy compliance and audit completeness. Healthcare teams watch faithfulness to clinical sources. Logistics and retail teams watch latency and cost per order. Strong AI agent monitoring lets each owner see the signals that matter to them, drawn from the same shared traces.
Working definition
“AI agent monitoring is the continuous collection and analysis of traces, quality scores, cost and latency data from AI agents in production, used to detect failures early, explain behaviour and guide improvement.”
Foundations
One trace per run, with a span for every model call, tool call and handoff, linked by a shared trace ID.
Faithfulness, relevance and task success scores on sampled runs, from automated judges and human reviewers.
Tokens, model fees and tool charges per run, rolled up by agent, team and customer.
Time per step and failure rates per tool, measured against agreed service level objectives.
Core capabilities
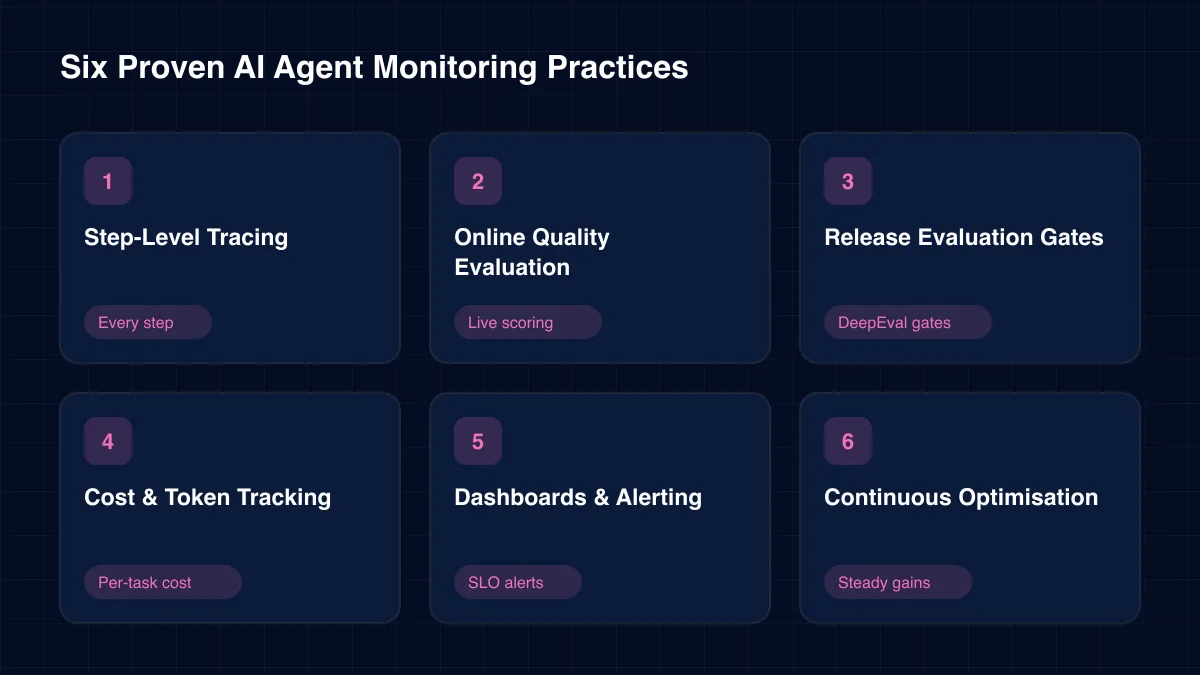
These are the practices we implement. Each one closes a blind spot that standard application monitoring leaves open.
OpenTelemetry instrumentation that follows GenAI semantic conventions for model and tool spans. AI agent monitoring starts with seeing every step of every run.
Every step
Automated judges score sampled production runs for faithfulness, relevance and policy compliance. Low scores open review tasks for your experts.
Live scoring →Golden test sets replayed on every change, with thresholds that block weak releases. We have built DeepEval quality gating into a multi-tenant LLM pipeline before.
DeepEval gates →Spend per agent, step and customer, with budgets and alerts. AI agent monitoring makes cost a daily signal, not a monthly surprise.
Per-task cost
Prometheus and Grafana dashboards with SLO-based alerts routed to the right on-call team. Our monitoring platform work reached 99.9% uptime and 80% faster recovery.
SLO alerts →Monthly reviews turn monitoring data into prompt, routing and tool fixes, run as part of our wider AgenticOps service.
Steady gains →Architecture
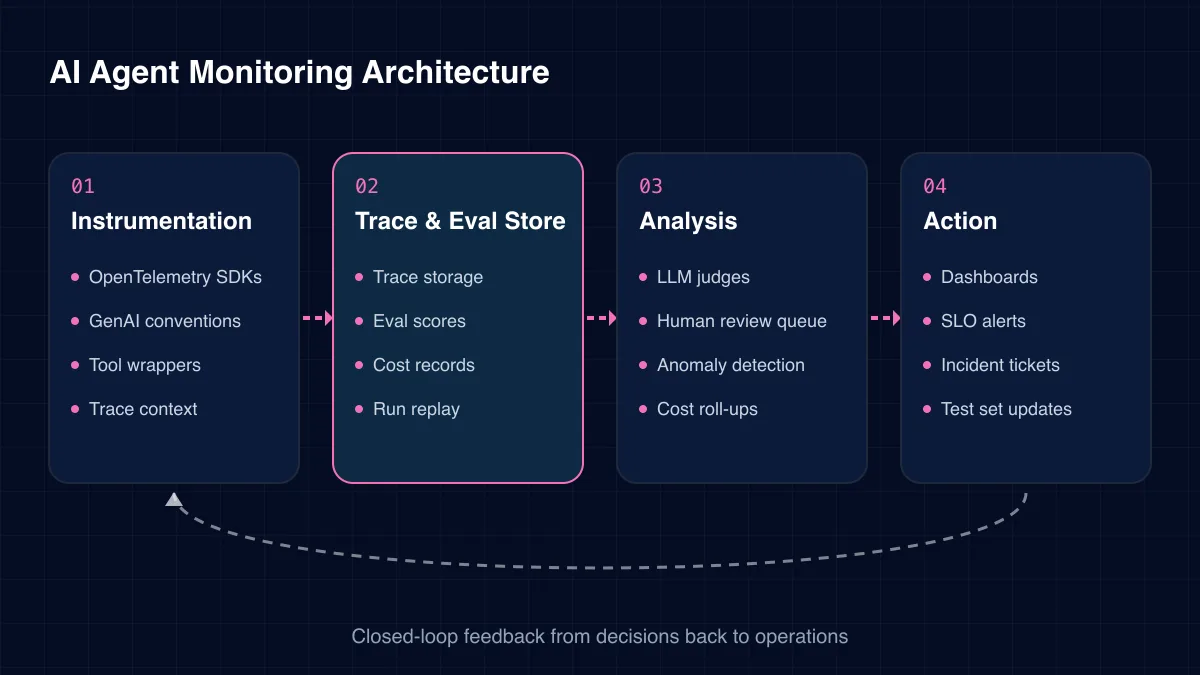
Monitoring runs in four layers. The trace and evaluation store is the core: every other view is built from it.
01
02
03
04
Challenges we solve
Teams usually have some monitoring. These are the gaps we find when agents misbehave.
Uptime and latency look fine while answer quality has dropped. Nobody measures correctness.
Model calls and tool calls are logged separately. Rebuilding one run takes hours of searching.
A retry loop or long context burns tokens for days before the bill arrives.
A tool returns empty data, the agent carries on, and the error only shows up in a complaint.
Without a quality baseline, nobody can say whether a new model version made things better or worse.
Every small blip pages someone. Real problems hide in the noise.
Coverage grows in layers. Each one answers a different question about your agents.
Standard tools cover part of the picture. This table shows what each one sees.
| Criterion | Classic APM | LLM call logging | Agent monitoring |
|---|---|---|---|
| Uptime and latency | ✓ Yes | Partial | ✓ Yes |
| Full run traces | Partial | No | ✓ Yes |
| Answer quality scores | No | No | ✓ Yes |
| Cost per task | No | Partial | ✓ Yes |
| Best for | Services | Debugging prompts | Production agents |
These gains appear once traces, quality, cost and alerts live in one place.
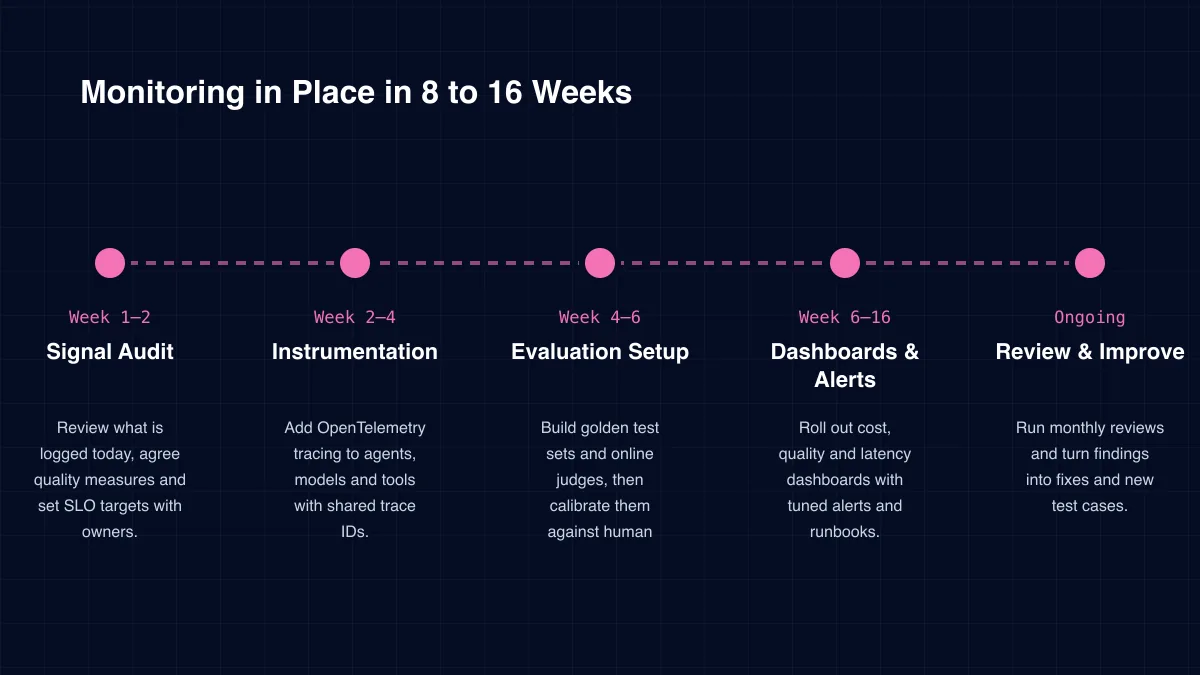
Delivery
Week 1–2
Review what is logged today, agree quality measures and set SLO targets with owners.
Week 2–4
Add OpenTelemetry tracing to agents, models and tools with shared trace IDs.
Week 4–6
Build golden test sets and online judges, then calibrate them against human reviews.
Week 6–16
Roll out cost, quality and latency dashboards with tuned alerts and runbooks.
Ongoing
Run monthly reviews and turn findings into fixes and new test cases.
Specialist services within our agenticops practice.
We recommend checking these five points before you commit.
In our experience, the action loop is what most monitoring projects miss. Dashboards alone change nothing. We tie every alert to an owner and every review to a list of fixes.
Traces can hold sensitive prompts and outputs. We mask personal data at capture time, restrict trace access by role and keep trace stores in your chosen region.
Monitoring also strengthens security. Unusual tool use, sudden volume spikes and prompt injection attempts show up in traces, and alerts route them to your security team.
ICANIO works under ISO 9001 and ISO 27001 certified processes. Retention periods follow your policy, and every access to trace data is itself logged.
Sampling rules are agreed with your data owners up front. Some workflows, such as those touching health or payment data, may store only metadata and scores, never raw text. AI agent monitoring still works in that mode, because trace structure, timings, tool outcomes and quality scores reveal most problems without exposing content.
AI agent monitoring pays for itself mainly through faster fixes and lower spend. Measure mean time to detect and resolve agent issues today, along with monthly model spend.
After rollout, cost tracking usually exposes quick wins: retry loops, oversized contexts and steps that a smaller model could handle. Quality monitoring cuts the time customers spend with a broken agent.
There is a strategic return as well. With reliable quality and cost data, you can compare models on your own traffic and switch with confidence, rather than guessing from public benchmarks.
Finally, monitoring supports trust. Risk teams, auditors and business owners want proof that agents behave as intended. Quality trends, override rates and incident records give them that proof in a form they can review. Good AI agent monitoring therefore speeds up approval of new agents as well as keeping current ones healthy.
Technology stack
We favour open standards and integrate with the observability tools you already run.
Instrumentation
GenAI semantic conventionsW3C Trace Context
Agent Tracing
LangfuseArize PhoenixLangSmith
Evaluation
DeepEvalLLM-as-judgeHuman review queues
Metrics & Alerts
Slack alerts
Logs & Storage
Structured logsObject storage
Cost
Token metersBudget alertsFinOps reports
AI agent monitoring tracks what agents do in production: each step, tool call, answer, cost and delay. It adds quality scoring to classic metrics, because an agent can be fast and available yet still wrong.
Application performance monitoring shows uptime, latency and errors. AI agent monitoring adds full reasoning traces, answer quality scores and cost per task, which APM tools do not capture on their own.
We sample live runs and score them with automated judges for faithfulness, relevance and policy compliance. Judges are calibrated against human reviewers, and low scores create review tasks.
We instrument with OpenTelemetry and its GenAI conventions, then send traces to tools such as Langfuse, Arize Phoenix or your existing stack. Open standards keep your data portable.
Yes. Cost tracking per step usually reveals retry loops, oversized prompts and steps that can move to smaller models. Our team turns those findings into routing and caching changes.
Usually, yes. If we can add instrumentation or capture traffic at the tool gateway, we can trace and score the agent regardless of who built it.
How we deliver ai agent monitoring and the wider agenticops practice in each sector.
Agents fail in quieter ways than ordinary software. AI agent monitoring makes those failures visible through traces, quality scores, cost data and alerts that point to the exact step at fault.
ICANIO brings proven monitoring practice to agent systems, from cloud dashboards to evaluation gates. In manufacturing, the same discipline that watches IoT telemetry and predictive maintenance machine learning models now watches agents. Contact us to set up AI agent monitoring that leads to real fixes.
A sensible first step is small. Pick your busiest agent, add tracing and a handful of quality checks, and watch it for two weeks. The gaps you find will show where to invest next, and the fixes they lead to usually justify the wider rollout on their own.
By ICANIO AgenticOps Engineering Team · Published · Updated
Tell us how your agents run today. We will show which signals are missing and how to add them without slowing your teams.
Contact Our Monitoring Team