
Entity tracking performance is one of those problems that rarely shows up in early development. It runs fine through every demo, then quietly becomes the reason a production application starts timing out under real load. The cause is usually the ORM's change tracking mechanism. That is the system that detects which records changed before it writes updates to the database. Once data volume grows past what a development environment ever tested, it can consume far more memory and CPU than anyone expected.
The mechanism is simple in concept. An object-relational mapper like Entity Framework keeps a snapshot of every entity it loads. When a save runs, it compares that snapshot against the current state and generates the minimal set of commands needed. That comparison is convenient, because developers do not write update statements by hand. It is also where entity tracking performance optimization becomes necessary, because the cost grows with the number of tracked entities.
Key Takeaways
- Entity tracking performance degrades as the number of tracked entities grows, so problems appear late.
- Entity Framework change tracking applies to every query by default, including read-only ones.
- AsNoTracking, eager loading and correct DbContext lifetimes fix most avoidable overhead.
- Bulk operations need their own approach: disabled auto-detection, batching or set-based updates.
- Measure tracked entity counts and generated SQL before choosing a fix.
What Is Entity Framework Change Tracking?
Object-relational mapping lets developers work with database rows as objects. Entity Framework is Microsoft's ORM for .NET, and EF Core is its modern version. Entity Framework change tracking is the feature that remembers what each loaded entity looked like originally.
When a query runs through a tracked DbContext, EF Core does more than return data. It registers each entity with the context's change tracker and stores an original-values snapshot next to the instance. A later call to SaveChanges can then work out exactly which properties changed. The official change tracking documentation describes the states involved: Added, Unchanged, Modified, Deleted and Detached.
This design follows the unit of work pattern. The context collects changes during a business operation, then commits them together. It is a sound pattern. The trouble starts when the unit of work grows much larger than intended.
Why Entity Tracking Performance Becomes Urgent
Most teams meet entity tracking performance as a production incident, not a planned improvement. A batch import that handled a few hundred records in staging suddenly takes minutes in production. A reporting endpoint that felt instant during development starts timing out as tables grow.
These are not bugs in the traditional sense. The code does exactly what it was written to do. The underlying tracking behavior simply was not designed with that data volume in mind.
Each SaveChanges call runs change detection across tracked entities by default. As the tracked count grows into the thousands, that work grows too, along with memory for snapshots. Teams that miss this treat every later slowdown as an isolated bug. In reality, the same tracking overhead keeps resurfacing in new places.
Common Symptoms
Watch for these signs of database entity tracking issues:
- Memory that climbs steadily during a long request or background job.
- SaveChanges calls that get slower as a loop progresses.
- Read-only pages that allocate far more memory than their payload suggests.
- Timeouts that appear only once production tables reach a certain size.
The 5 Entity Tracking Performance Fixes at a Glance
The table below summarizes the five fixes covered in this guide and when to reach for each.
| Fix | Best for | Main gain |
|---|---|---|
| 1. AsNoTracking | Read-only queries | No snapshots |
| 2. Eager loading | Parent-child loops | Fewer round trips |
| 3. Scoped DbContext | Web requests, jobs | Bounded memory |
| 4. Bulk strategies | Large imports, updates | Less detection work |
| 5. Projections | Reports, dashboards | No materialization |
Fix 1: AsNoTracking for Read-Only Queries
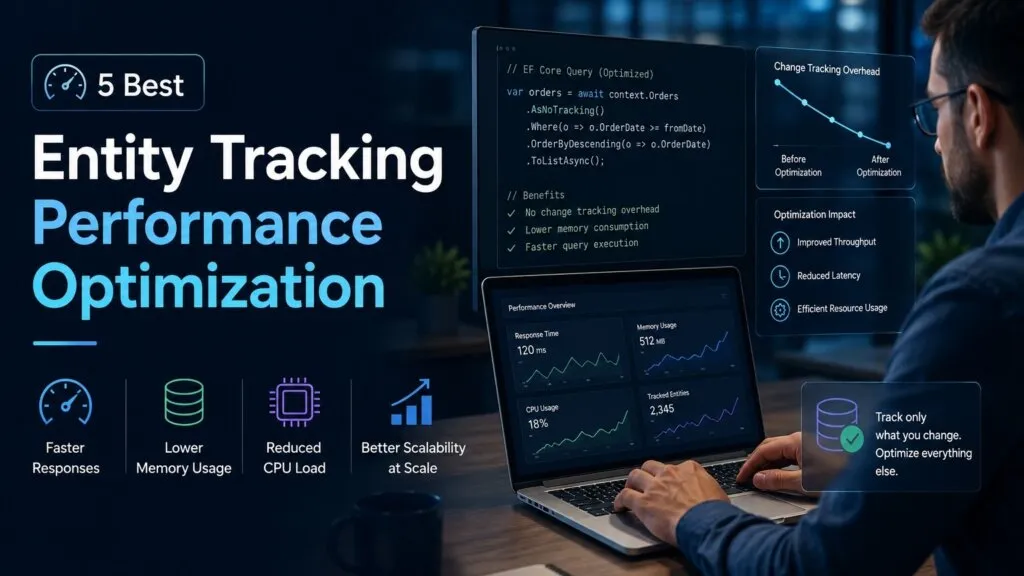
Entity Framework change tracking is applied by default to every query. That includes read-only queries that will never call SaveChanges. A reporting page that loads ten thousand records for display still pays for snapshot creation and tracking registration on every one. This is the most common source of avoidable overhead in applications that have not had deliberate entity tracking performance optimization.
The most direct fix is AsNoTracking on any query whose results will not be modified and saved. The gain comes from skipping snapshot creation and registration entirely. Microsoft's guide to tracking versus no-tracking queries explains the behavior in detail.
var orders = await db.Orders
    .AsNoTracking()
    .Where(o => o.Status == "Open")
    .ToListAsync();
In our team's experience, auditing read-heavy endpoints and adding AsNoTracking where appropriate often resolves a good share of the complaints that triggered an investigation. It is a cheap, low-risk entity tracking performance win that is easy to review.
There is one tradeoff. Untracked queries do not perform identity resolution, so the same row can appear as separate object instances. AsNoTrackingWithIdentityResolution addresses that edge case. It gives teams a middle option between full tracking and full detachment.
Fix 2: Eager Loading to Stop N+1 ORM Performance Bugs
Entity tracking performance is rarely the only contributor to a slow data layer. Several related ORM performance bugs tend to appear together, and the N+1 query problem is the most common.
Lazy loading triggers a separate query when a navigation property is first accessed. A loop over a thousand parent entities that touches a lazy child collection generates a thousand extra round trips. Each one also registers more tracked entities if tracking is on. The two problems compound, and entity tracking performance suffers twice.
Explicit Include statements collapse this into one query, or a few. Combined with AsNoTracking for read-only scenarios, eager loading addresses both problems at once. For large graphs, split queries can avoid the row explosion that a single joined query sometimes causes.
Fix 3: Scope the DbContext to the Unit of Work
A DbContext that lives too long creates database entity tracking issues. It keeps references to every entity it has tracked during its lifetime. A long-lived context in a web application can accumulate entities across many unrelated requests if it is not scoped correctly.
This is rarely diagnosed as a tracking issue at first. The symptoms are rising memory and slowing saves. They often get blamed on garbage collection pressure or connection pool exhaustion instead. The real cause is poor entity tracking performance from an oversized tracking graph.
The fix is to match context lifetime to the unit of work. In ASP.NET Core, the default scoped registration gives one context per request. For background jobs, create a fresh context per batch. The DbContext lifetime documentation covers the recommended patterns. Calling ChangeTracker.Clear between batches is another simple option when a context must be reused.
Fix 4: Strategies for Bulk Operations
Bulk inserts and updates expose entity tracking performance problems most dramatically. These are the scenarios where entity count grows fastest. Per-entity overhead compounds most visibly here.
In classic Entity Framework 6, each Add call triggered change detection across every tracked entity. Cost grew much faster than the record count. EF Core is more efficient, but large tracked graphs still cost memory and detection time when SaveChanges runs. So bulk operations deserve their own entity tracking performance design.
Disable Automatic Change Detection Temporarily
For large bulk operations, one option is to turn off automatic change detection for the duration of the work. Re-enable it afterward inside a try-finally block. That guarantees tracking returns to its expected state even if an exception interrupts the job.
db.ChangeTracker.AutoDetectChangesEnabled = false;
try
{
    db.Products.AddRange(newProducts);
    await db.SaveChangesAsync();
}
finally
{
    db.ChangeTracker.AutoDetectChangesEnabled = true;
}
Leaving detection disabled by accident produces confusing behavior in whatever code runs next. The finally block prevents that.
Batch and Use Set-Based Updates
Two more techniques help with bulk operations:
- Batching: save in chunks of a few hundred or thousand rows, then clear the tracker before the next chunk.
- Set-based commands: EF Core 7 and later offer ExecuteUpdate and ExecuteDelete, which run a single SQL statement without loading entities.
- Range methods: AddRange registers many entities in one call rather than one at a time.
- Specialist libraries: dedicated bulk extensions bypass per-entity tracking for very high volumes.
Each option trades some ORM convenience for better entity tracking performance and throughput. Use them where per-record change detection adds no real value.
Fix 5: Projections and Bypassing the ORM
Not every database entity tracking issue is best solved by tuning tracking behavior. Sometimes the honest answer is that a query does not need entity mapping at all. Reporting queries, dashboard aggregations and analytics workloads often perform better as projections.
Projections are the strongest entity tracking performance tool for reads. A projection selects only the columns you need into a lightweight model. EF Core does not track projected types that are not entities. The database also performs aggregation more efficiently than application code looping over full entity graphs.
For the heaviest read paths, a lighter data access layer or raw SQL can skip materialization entirely. Our team reserves this for clearly read-only, high-volume paths. We keep the full ORM, change tracking included, for transactional, write-heavy parts of an application. Treating this as a deliberate architectural choice produces more maintainable systems than either extreme.
Diagnosing Entity Tracking Performance Before a Crisis
Most teams have no visibility into how many entities a context is tracking at a given moment. That makes tracking-related slowdowns hard to diagnose. EF Core exposes ChangeTracker.Entries(), which can be inspected at runtime. Logging its count at key points gives a measurable signal instead of vague symptoms.
Our team recommends adding this lightweight instrumentation early. A small middleware component can log tracked entity counts for requests above a threshold. It costs little to maintain and gives early warning before users notice. Pairing it with structured logging and production observability lets teams correlate spikes with specific endpoints, query patterns or batch windows.
Profile Round Trips Alongside Tracking
Tracking overhead rarely exists in isolation from query efficiency. A thorough diagnosis looks at both together. Capture generated SQL alongside execution time. That reveals whether a slow endpoint suffers from:
- Excessive round trips, often the N+1 pattern.
- Expensive queries against poorly indexed tables.
- In-memory tracking overhead across a large result set.
- Lock contention, which isolation settings such as SQL Server RCSI can reduce.
Distinguishing these matters because each has a different fix. Not every slow query is an entity tracking performance problem. A tracking fix applied to an indexing problem wastes effort. Microsoft's EF Core performance guide is a good companion checklist.
A Representative Entity Tracking Performance Pattern
A common pattern starts with a dashboard built as a simple aggregation over a few hundred records. Over a year or two of normal business growth, it ends up touching tens of thousands of rows. Nobody deliberately decided it should work that way.
The original version used a tracked DbContext query and lazy-loaded navigation properties. It performed acceptably at launch, long enough that nobody revisited it. Then data growth crossed a threshold. The combined cost of tracking and N+1 queries became visible as multi-second load times.
The fix is rarely a single change. Our team usually applies several together:
- Convert the query to AsNoTracking, since dashboard data is read-only.
- Replace lazy loading with explicit eager loading to cut round trips.
- Project directly into a reporting model instead of full entity graphs.
- Let the database perform the aggregation.
Applied together, these entity tracking performance changes can cut load times substantially, often without any schema or infrastructure change. The exact gain depends on data shape and indexing, so measure before and after.
Building Entity Tracking Performance Into the Dev Process
The most effective entity tracking performance optimization happens before an incident forces it. Good software development practice sets default query patterns early:
- AsNoTracking as the default for read paths.
- Explicit Include statements rather than lazy loading.
- DbContext lifetime scoped to the unit of work.
- Set-based commands for bulk operations.
Code review checklists that cover entity tracking performance, plus automation in the build pipeline, help keep these habits consistent. Some teams add performance tests to their DevOps pipeline that fail when a query exceeds a tracked-entity budget. Our Application Development teams apply these defaults from the first sprint.
Support engineering plays an ongoing role too. Entity tracking performance is not a one-time fix. Query patterns that performed acceptably at launch degrade as data grows, whether the app runs on premises or in the cloud. Regular reviews through our support engineering services catch that drift while it is still cheap to fix. For a related EF Core pitfall, see our EF Core unique constraint and change tracker fix.
Conclusion
Entity tracking performance problems hide during development and surface in production. The fixes are well understood: AsNoTracking for reads, eager loading against N+1 ORM performance bugs, scoped contexts, dedicated strategies for bulk operations, and projections for reports.
Measure entity tracking performance first, then apply the fix that matches the cause. Build the defaults into your process so the same problem does not return in a new feature next year. If your application is slowing down as data grows, contact ICANIO and our engineers can help you find where the time goes.
References
- Object-relational mapping, Wikipedia
- Entity Framework, Wikipedia
- Unit of work, Wikipedia
- Change tracking in EF Core, Microsoft Learn
- Tracking vs. no-tracking queries, Microsoft Learn
- Single vs. split queries, Microsoft Learn
- DbContext lifetime and configuration, Microsoft Learn
- ExecuteUpdate and ExecuteDelete, Microsoft Learn
- EF Core performance, Microsoft Learn
Frequently asked questions
What causes entity tracking performance problems?
Change tracking cost grows with the number of entities a context holds. Each tracked entity needs a snapshot in memory, and SaveChanges runs change detection across them. Applications that perform well in development with small data sets can degrade sharply once production data grows. Long-lived contexts, lazy loading loops and large bulk operations make the problem worse.
Does AsNoTracking affect data accuracy?
No. AsNoTracking only controls whether the context monitors an entity for changes after loading it. The data returned from the database is identical. The difference is that untracked entities are not included in a later SaveChanges call, even if you modify their properties in memory. AsNoTracking improves entity tracking performance without changing results. Use tracked queries for any data you intend to update.
How common are ORM performance bugs in production applications?
They are common. Default ORM behavior favors developer convenience over raw performance, which is reasonable for most code. Many teams do not revisit tracking configuration until data volume or traffic exposes the overhead. Regular entity tracking performance reviews, profiling of generated SQL and simple tracked-entity logging catch these issues before users feel them.
Should change tracking be disabled across an entire application?
Usually not. The better pattern is to disable tracking selectively for read-only queries and bulk operations. Keep it enabled for transactional, write-heavy paths where automatic change detection adds real value. You can set a no-tracking default on a read-focused context, but make the choice deliberately and document it for the team.
How does ICANIO approach database entity tracking issues?
Our team starts by auditing existing query patterns and measuring tracked entity counts and generated SQL. We then apply targeted fixes such as AsNoTracking, eager loading, corrected context lifetimes and set-based bulk updates. Support engineering continues monitoring as data volume grows, so regressions are caught early rather than discovered through user complaints.
Is EF Core faster than Entity Framework 6 for bulk operations?
Generally yes. EF Core redesigned change detection and added batching of SQL commands. EF Core 7 and later also offer ExecuteUpdate and ExecuteDelete for set-based changes without loading entities. Large tracked graphs still hurt entity tracking performance, though. For very high volumes, batching, clearing the tracker and dedicated bulk tools remain worthwhile.